HSE University
Storing and Retrieving Data: What a Manager Needs to Know Before Talking to IT
An extended companion to an HSE University lecture on data types, DBMS, storage architectures and the role of data in modern business
Last year I gave an online lecture at HSE University on “Storing and Retrieving Data”. It was my first experience of this kind, and the audience was unusual for me: not fellow developers, architects or data engineers, but leaders from different functions in large companies.
These are people who make decisions every day. They are responsible for processes, budgets, teams, metrics, risks and business growth, but they are not expected to know how to write SQL queries, configure database sharding or design distributed storage.
That is why the goal was not to turn managers into engineers in three hours. That would be impossible, and it is not needed.
The goal was different: to explain how the world of data works at a level that is enough for a meaningful management conversation.
Not at the level of “oh, this is all IT, let them deal with it”. And not at the level of “let's urgently implement AI because everyone else is doing it”. Somewhere in the middle: so a leader understands what data the company has, where it comes from, where it flows, why reports disagree, why storage layers are needed, why one database does not solve every problem, and why artificial intelligence without proper data becomes an expensive toy.
This article is an expanded companion to that lecture.
> Who this article is for: managers, analysts and product leaders who want to speak the same language as engineers and architects. You do not need to know SQL. It is enough to understand what data exists, where it comes from and why it matters for the business.
### In short
- Data is an asset, not a by-product. Without owners, standards and quality, it turns into noise.
- There is no universal database. SQL, NoSQL, column-oriented, graph and vector databases each solve a different class of problems.
- OLTP and OLAP should be separated. A cash register and an analytics department are different things, and their databases often should be different too.
- Architecture matters more than the tool. The path from source to decision is what defines value.
- AI starts with data. Without clean data, catalogs and access control, an LLM only accelerates chaos.
- Import substitution is a strategic project, not a one-time purchase. It requires workload, compatibility and risk analysis.
---
Data is an asset, not infrastructure
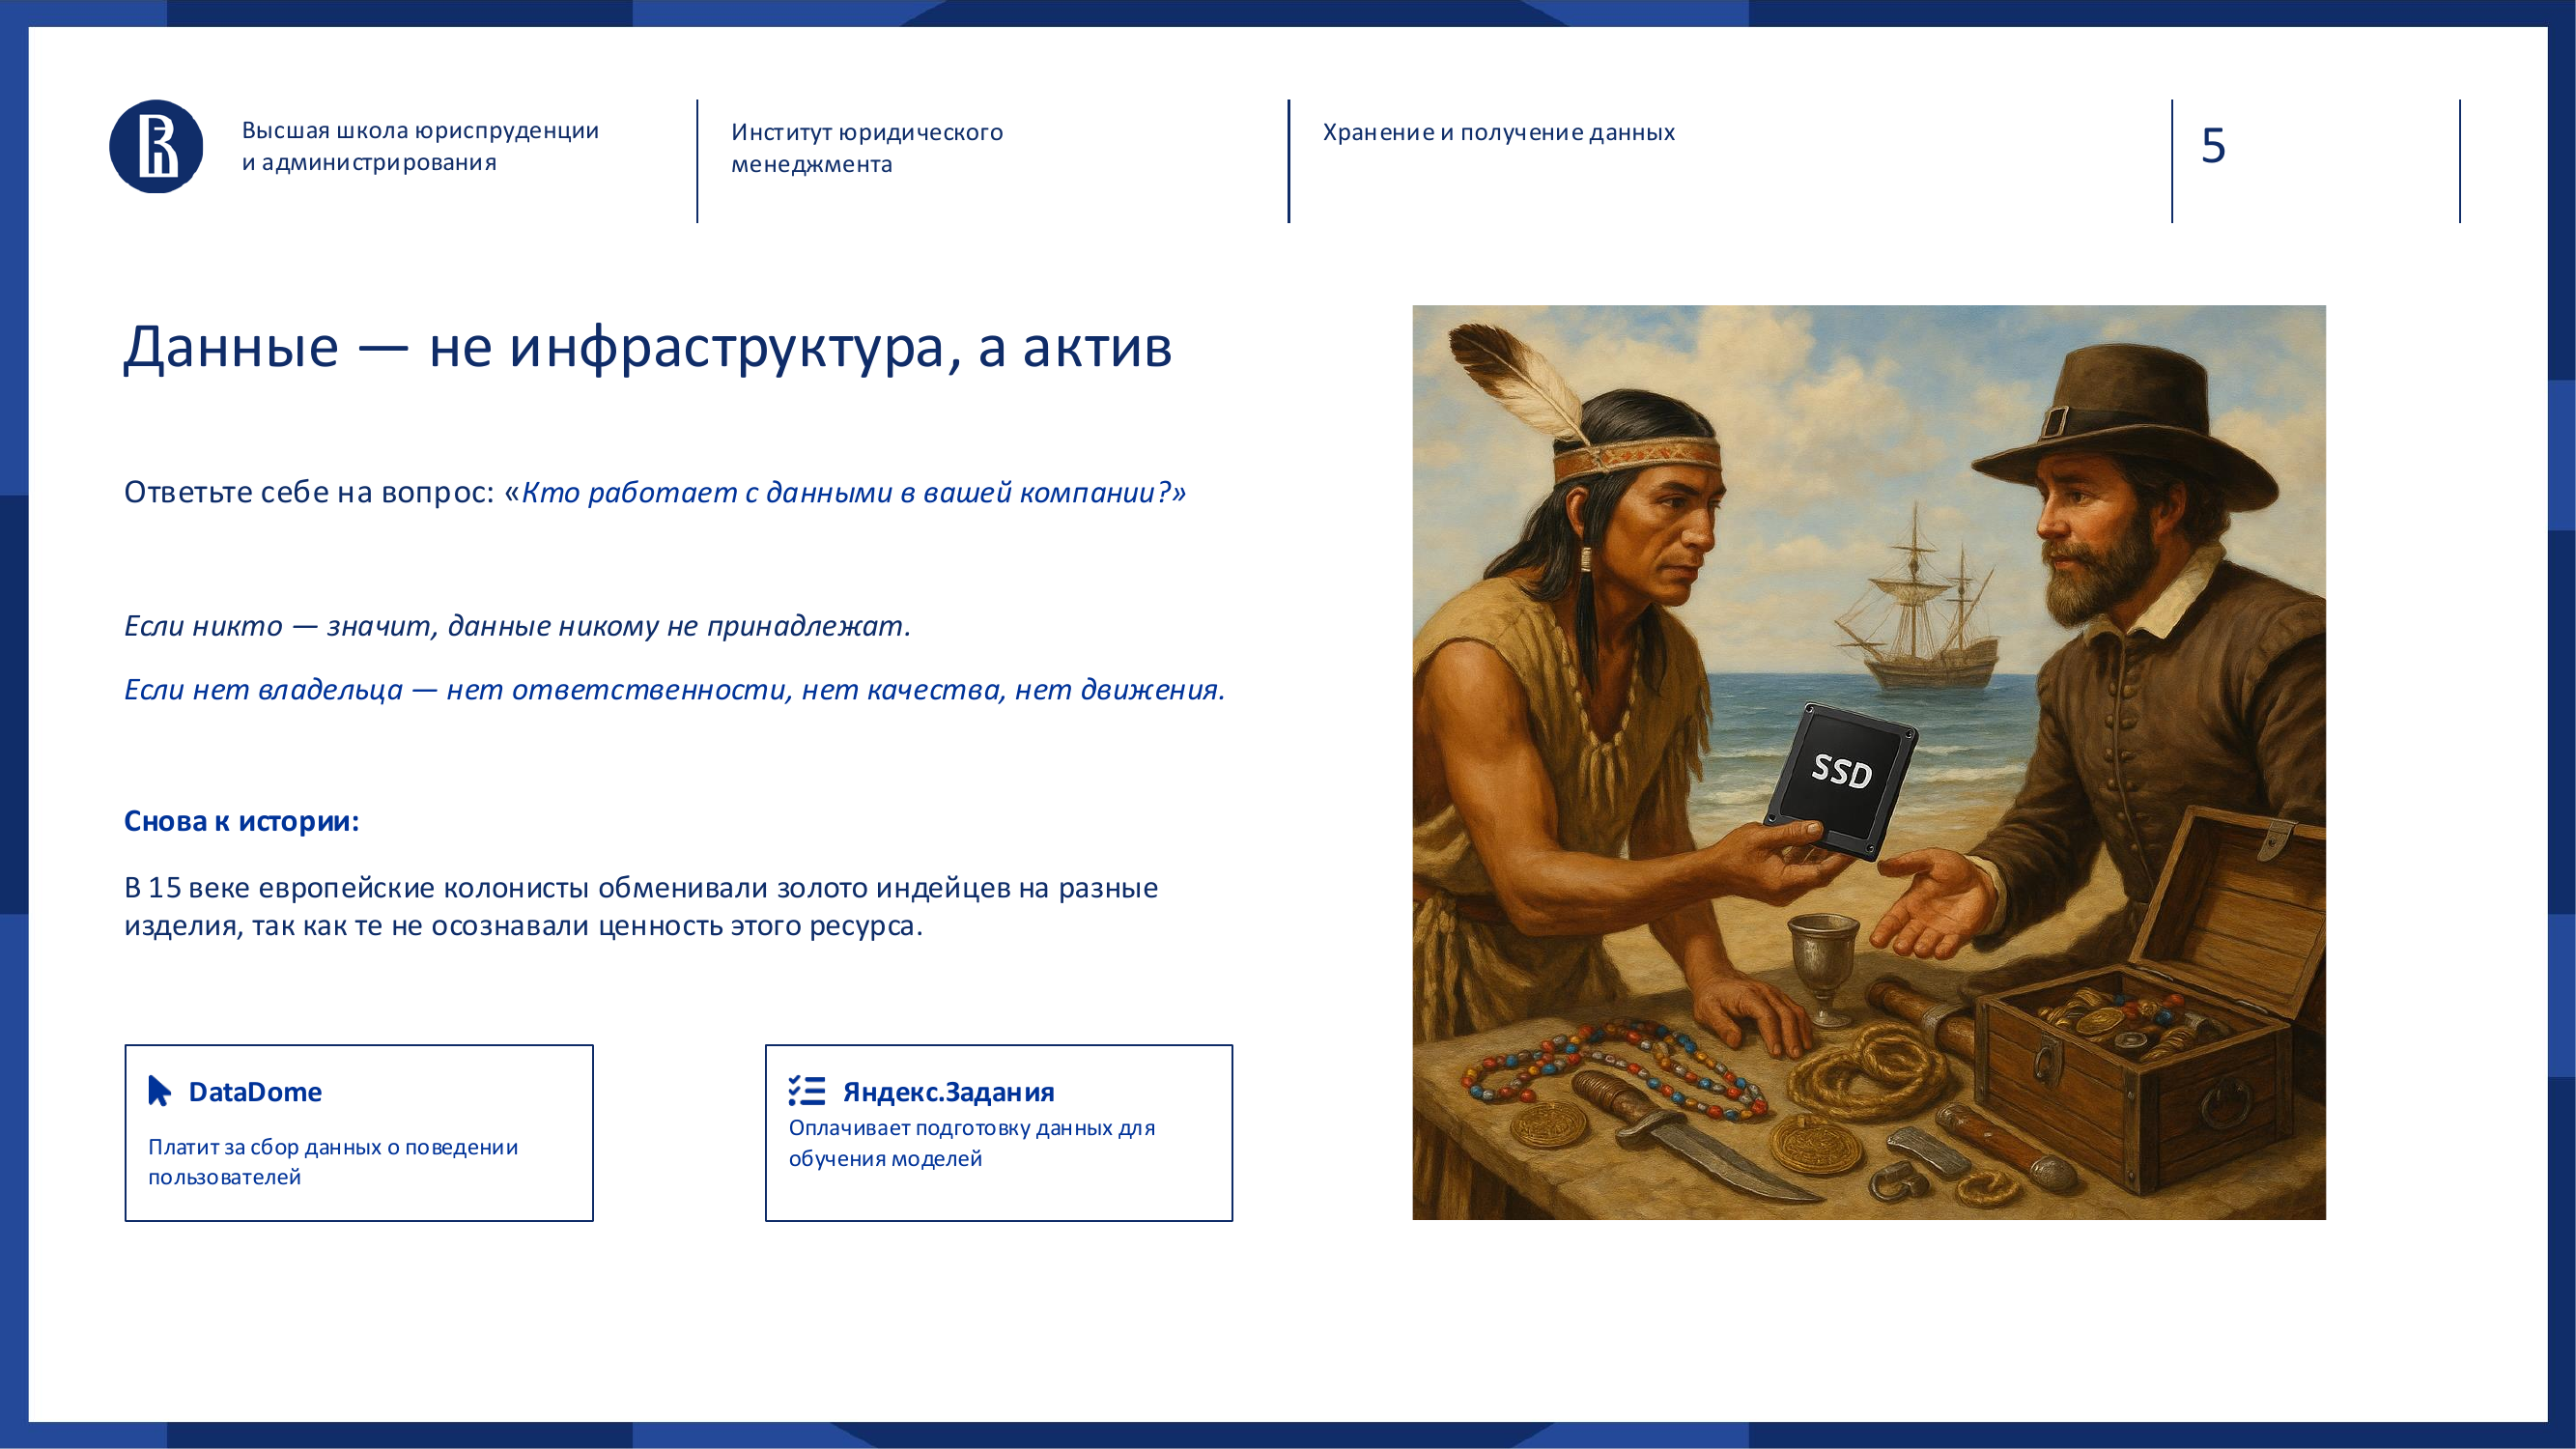
Let's start with a phrase almost everyone has heard:
> Data is the new oil. > In Russian: data is the new oil.
The phrase is usually attributed to Clive Humby. It has been repeated so often that it has become a little tired. But the problem is not the phrase itself. The problem is that many companies say it out loud while still treating data as something secondary.
As a by-product of systems doing their work.
- Somewhere in the CRM, there are customers.
- Somewhere in the ERP, there are purchases and inventory.
- Somewhere in the accounting system, there is finance.
- Somewhere in Excel, there is “the most correct version of the report”.
- Somewhere in email, there are agreements.
- Somewhere in the head of a department leader, there is the real KPI calculation logic.
Formally, the data exists. In practice, no one manages it.
This is where we need to fix one simple idea:
> Data has no value by itself if no one can work with it.
Oil is not especially useful if it simply stays underground. It has to be found, extracted, cleaned, transported, refined and turned into something useful. Data is similar.
If you only store it, it does not create business value.
- If it is messy, it causes harm.
- If it contradicts itself, people stop trusting it.
- If no one knows who is responsible for it, it quickly becomes digital waste.
So instead of saying “we have data”, it is better to ask less comfortable questions:
- Who is responsible for this data?
- Who understands what it means?
- Who monitors its quality?
- Who defines which data matters?
- Who can explain why two reports show different numbers?
- Who decides what data we need to start collecting now so that it is not too late in a year?
If the answer is “no one”, then the data belongs to no one.
The chain after that is short:
1. If there is no owner, there is no responsibility. 2. If there is no responsibility, there is no quality. 3. If there is no quality, there is no trust. 4. If there is no trust, data stops being an asset.
It becomes noise.
> Questions for a manager > > - Which data in your area of responsibility is considered critical? > - Does every such dataset have an owner? > - Who can explain report discrepancies without a manual investigation?
---
Why managers need to understand this
A manager who does not understand the basics of working with data is like a driver who does not know where to get fuel, where to put it and why it is needed at all.
Yet people still expect the car to move.
It is important not to confuse roles. A leader does not need to become a data engineer. They do not need to write pipelines by hand, choose PostgreSQL indexes or argue about the pros and cons of Kafka.
But they do need to understand the basic mechanics:
- how data appears;
- where it is stored;
- why it degrades;
- why reports disagree;
- how an operational database differs from an analytical one;
- why “put everything into one database” is not a strategy;
- what questions to ask IT, analysts and process owners.
> This is not a technical luxury. It is a management necessity.
Today almost every serious business decision depends on data in one way or another:
- launching a new product;
- optimizing inventory;
- measuring team performance;
- managing customer experience;
- automating a process;
- introducing AI;
- moving to domestic software;
- reducing operating costs;
- finding growth points.
If the data is bad, the decisions will be bad too. They will just look convincing because they can be shown nicely on a dashboard.
> A beautiful chart does not make data correct.
---
What old-style data work looks like
In companies without a systematic approach to data, the same problems usually repeat. Industries, scale and system names change, but the symptoms look very similar.
The first symptom is inconsistent reporting.
Finance shows one number. Sales shows another. Operations shows a third. Then come manual reconciliations, calls, Excel files, formula checks and the search for the “right version”.
The second symptom is duplicated reference data.
The same customer may be named differently in different systems. In one place it is “Romashka LLC”, in another “LLC Romashka”, somewhere the record is tied to a tax ID, somewhere to an internal ID, and somewhere to a manager's surname.
Until there is a shared identification logic, the company does not see the real picture. It sees a set of fragments.
The third symptom is decisions based on guesses.
When there is no trust in data, leaders return to intuition. Intuition matters, but it should not replace facts. Especially in a large company, where mistakes become expensive at scale.
The fourth symptom is high cost of introducing modern solutions.
A company wants BI, predictive analytics, personalization, an AI assistant or automatic processing of customer requests. Then it quickly turns out that data is scattered, poorly described, not cleaned, not connected and sometimes unclear from a legal point of view.
As a result, the modern solution can be introduced only after long and painful preparation. Sometimes it turns out that the company should not start with AI at all, but with cleaning up reference data.
The fifth symptom is slow information search.
People spend hours and days not on analysis, but on preparing data. Find a file. Check whether it is current. Ask a colleague. Verify a formula. Rebuild a table. Clarify why yesterday there was one value and today there is another.
This is the hidden cost of chaos.
---
Myths that stop companies from working with data
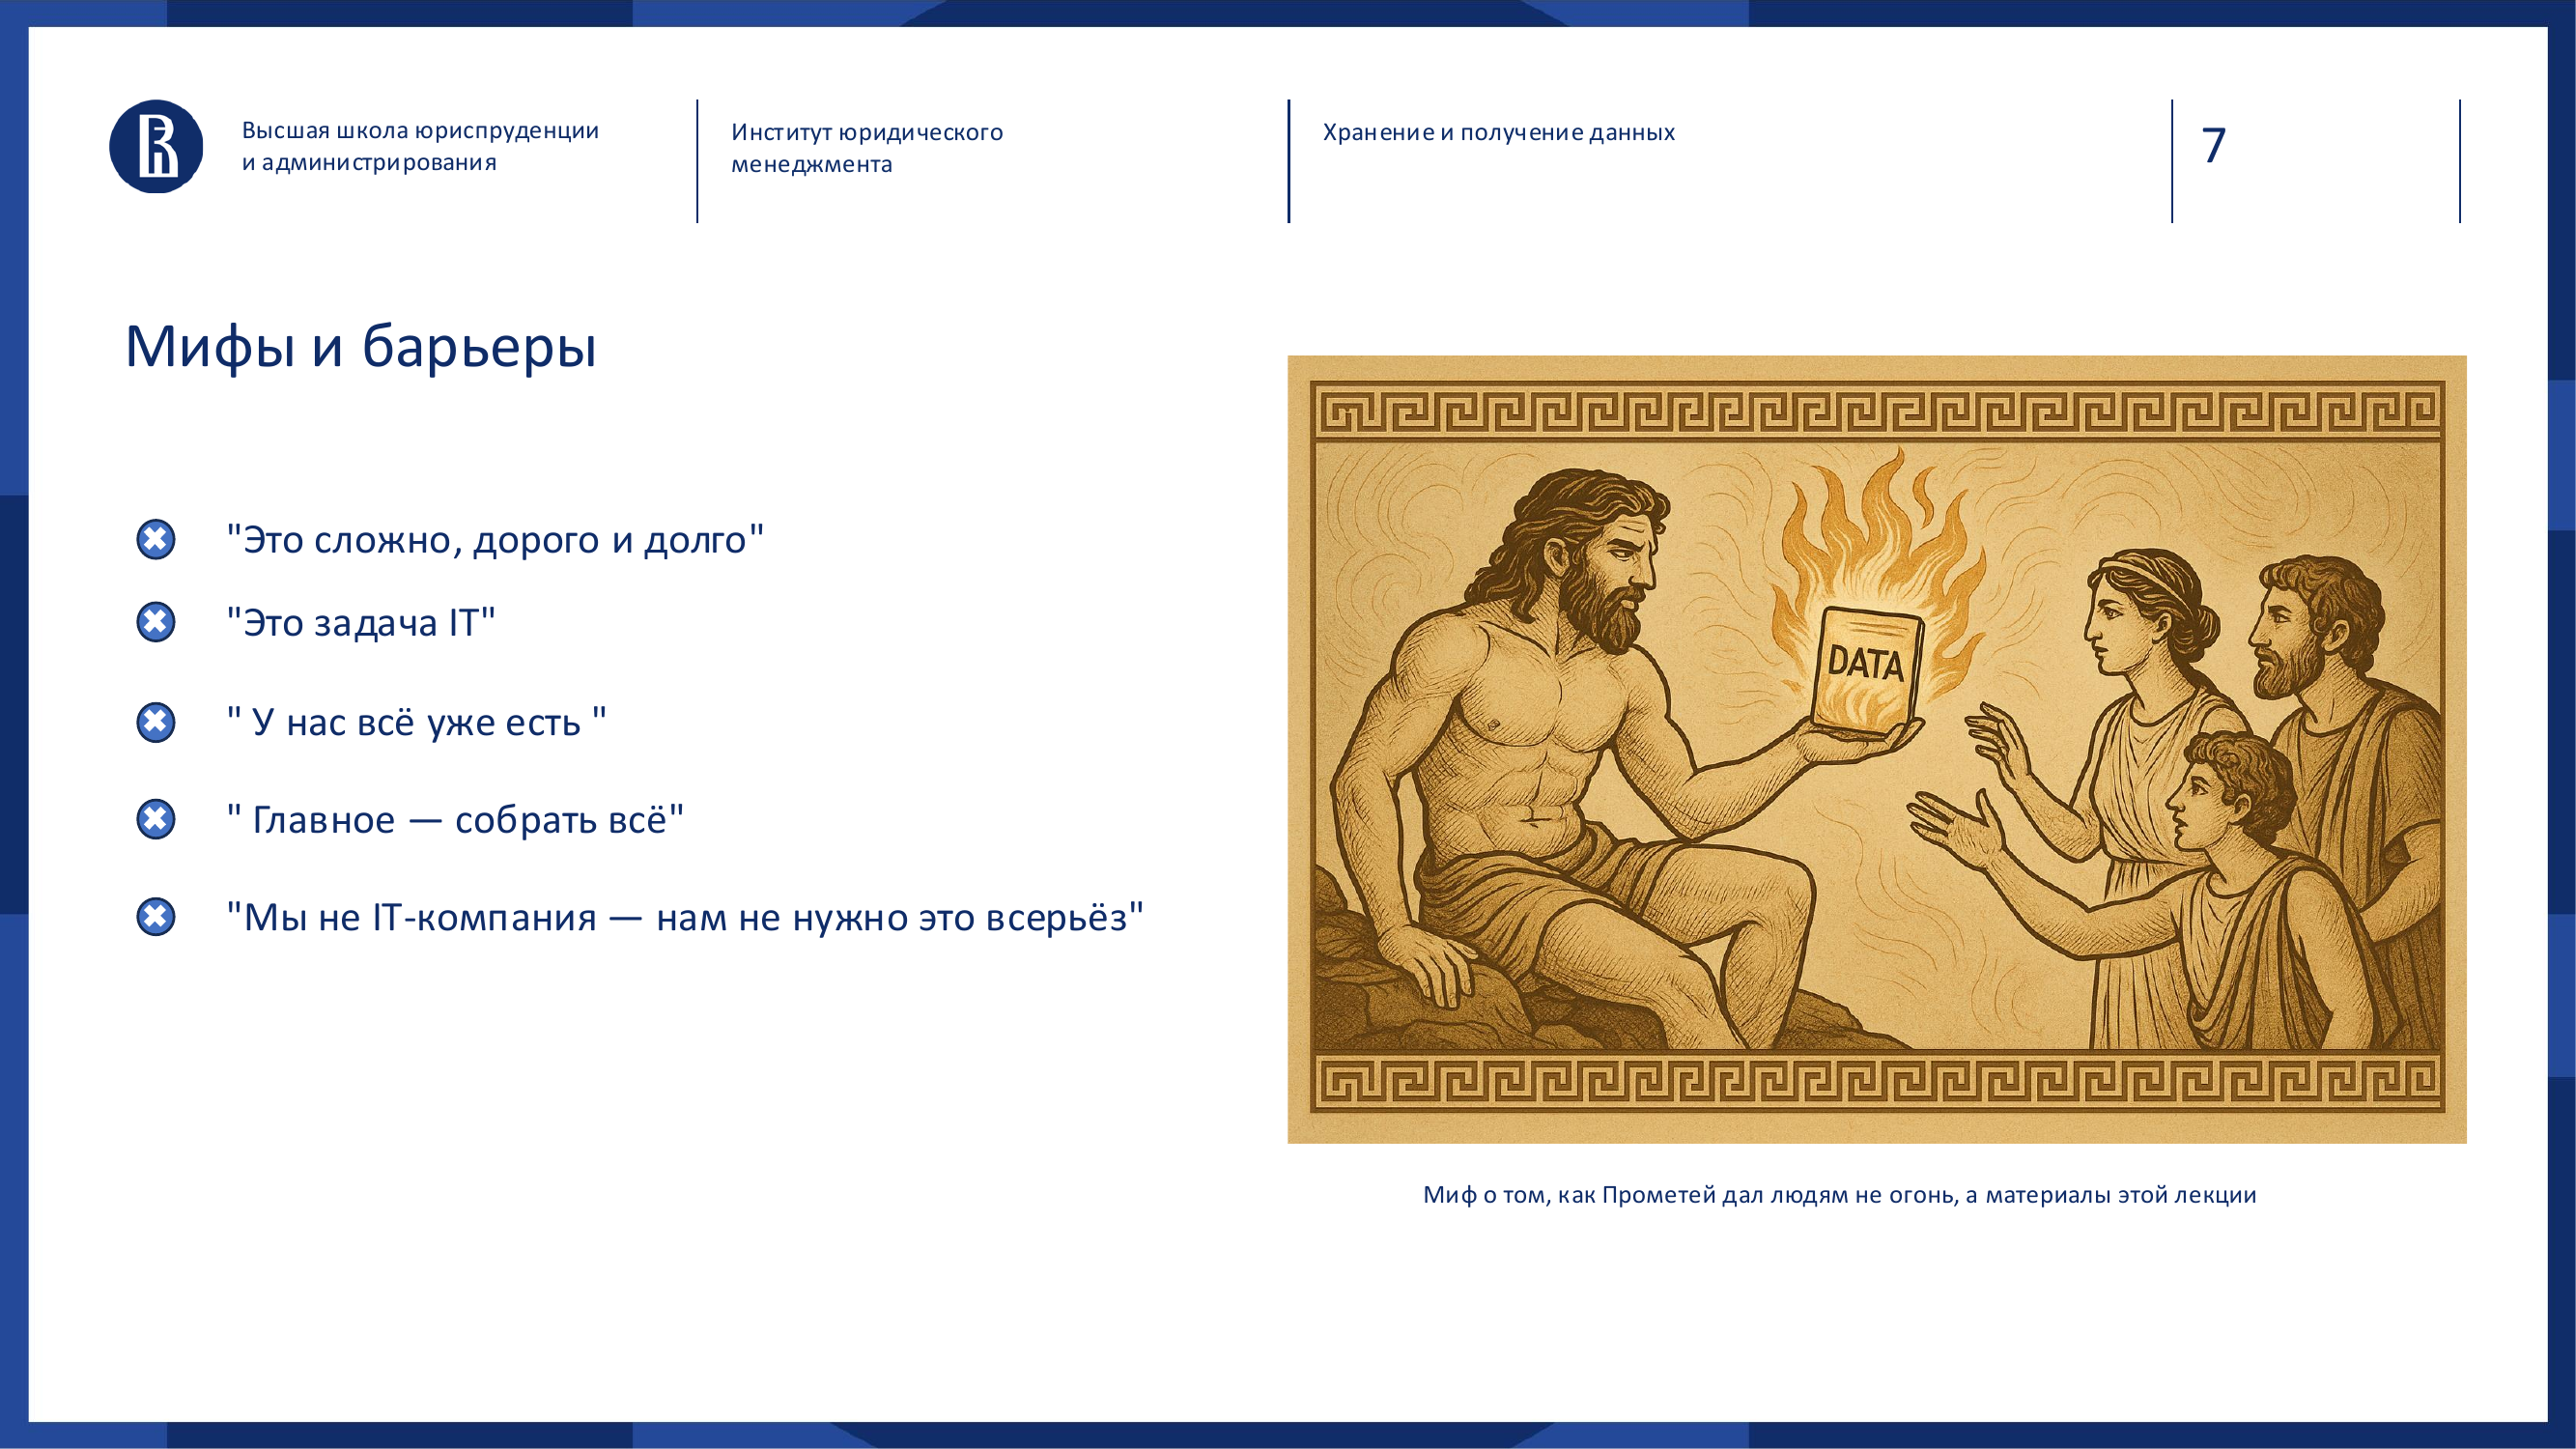
There are several persistent myths that make companies postpone proper data work for years.
### Myth 1. “It is complex, expensive and slow”
Sometimes it is complex. Sometimes it is expensive. Sometimes it is slow.
But the mistake is that many people imagine data work as a huge project where they must immediately introduce a DWH, Data Lake, Data Mesh, machine learning, a data catalog, governance, MDM and a corporate AI assistant on top.
In practice, the start can be much simpler.
For example:
- describe the key data sources;
- understand which reports are assembled manually;
- identify critical reference data;
- assign data owners;
- automate 2 or 3 reports that consume time every day;
- agree on shared definitions for key metrics.
This is already data work. And it already has an effect.
### Myth 2. “This is an IT task”
This is one of the most dangerous myths.
- IT can build infrastructure.
- IT can set up integrations.
- IT can provide storage, availability, security and performance.
- But IT does not always know what the “active customer” metric actually means.
- IT should not decide alone which data matters for the commercial function.
- IT cannot define the correct KPI calculation logic without the business.
- IT should not have to guess what data a leader will need in six months.
If data is an asset, the business cannot fully delegate responsibility for it to a technical function.
The right model looks different:
- the business defines meaning and value;
- analysts help interpret and model;
- IT provides the technical implementation;
- managers create a culture of data use.
> Questions for a manager > > - Which metrics in your function are considered key? > - Who approves their definitions? > - What has to be checked manually before an important decision today?
### Myth 3. “We already have everything”
Usually this means: “We have BI”, “We have CRM”, “We have a database”, “We have reports”.
But having a tool does not mean the company is mature in working with data.
BI may be installed, while departments still calculate metrics differently. CRM may be used, while managers still keep “their own spreadsheets”. A DWH may exist, while no one trusts the data. Reports may be automated, while their business logic is outdated.
“We already have everything” is a dangerous phrase. After it, companies often discover that they have tools, but not management.
### Myth 4. “The main thing is to collect everything”
No.
Collecting everything is not a strategy. It is warehousing.
If you simply put all data into one place, without describing it, assigning owners, setting quality rules or defining use cases, you do not get a Data Lake. You get a data swamp.
Everything seems to be there, but nothing can be found. And if you do find something, you do not know whether it can be trusted.
### Myth 5. “We are not an IT company, so we do not need this”
Data is not needed only by banks, marketplaces and BigTech.
Manufacturing uses data for load planning and equipment maintenance. Logistics uses it for routes, deadlines and warehouse inventory. HR uses it to analyze turnover and hiring efficiency. Legal functions use it for contracts, risks and claims. Customer service uses it to analyze requests and service quality.
If a company makes decisions, serves customers, manages resources and is responsible for results, it needs data.
### Myth 6. “Everything works fine already”
It works while the market is stable. While competitors have not become faster. While the regulator has not changed the requirements. While the key employee with the Excel file has not gone on vacation. While AI has not become necessary. While no crisis has happened.
Weak data work is often invisible in calm periods. It appears at the moment of change.
---
How the role of a manager is changing
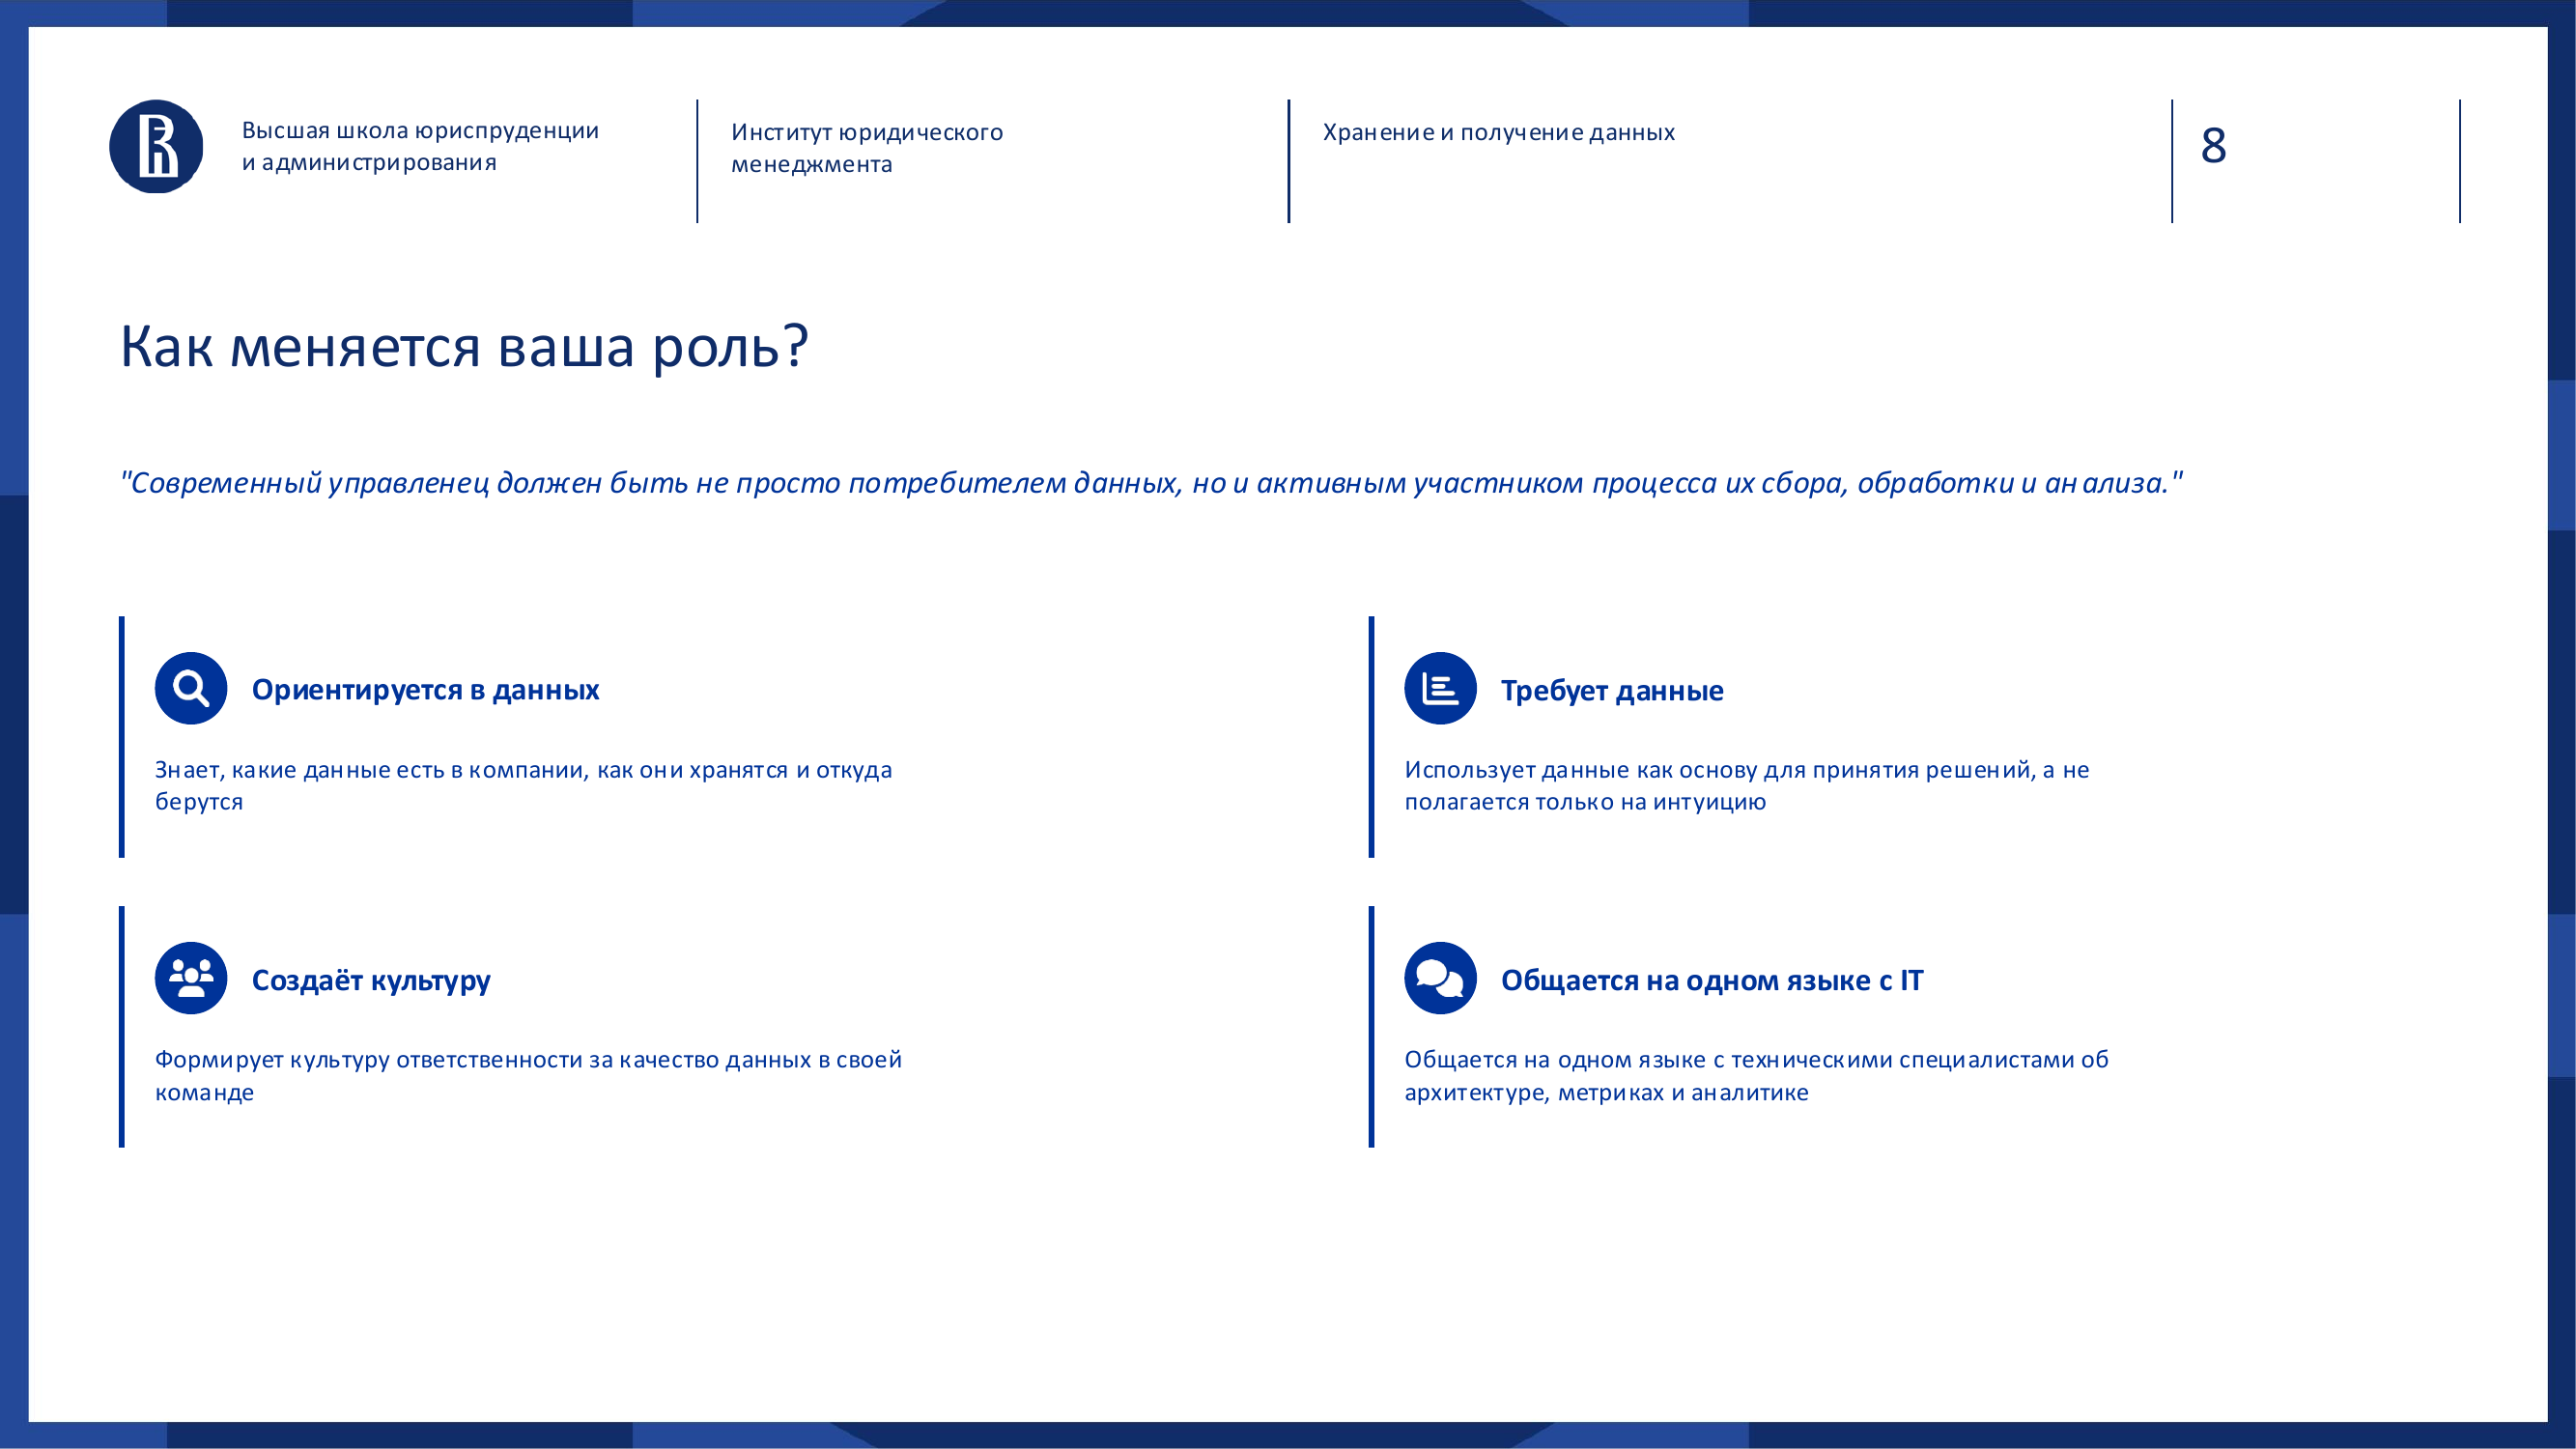
A modern manager should not be only a consumer of reports.
They should be a participant in data work.
This does not mean they must build data marts or design architecture by hand. But they should:
- understand what data exists in their area of responsibility;
- know where it comes from;
- understand how it is used;
- demand data as the basis for decisions;
- create a culture of responsibility for quality;
- speak the same language as IT and analysts.
A good management question today does not sound like this:
> Why don't we have a beautiful dashboard?
It sounds like this:
> Which decisions do we want to make faster and more accurately, what data do we need for that, where is it created, who is responsible for it and can we trust it?
That is the beginning of a mature approach.
---
A little history: why databases became so different
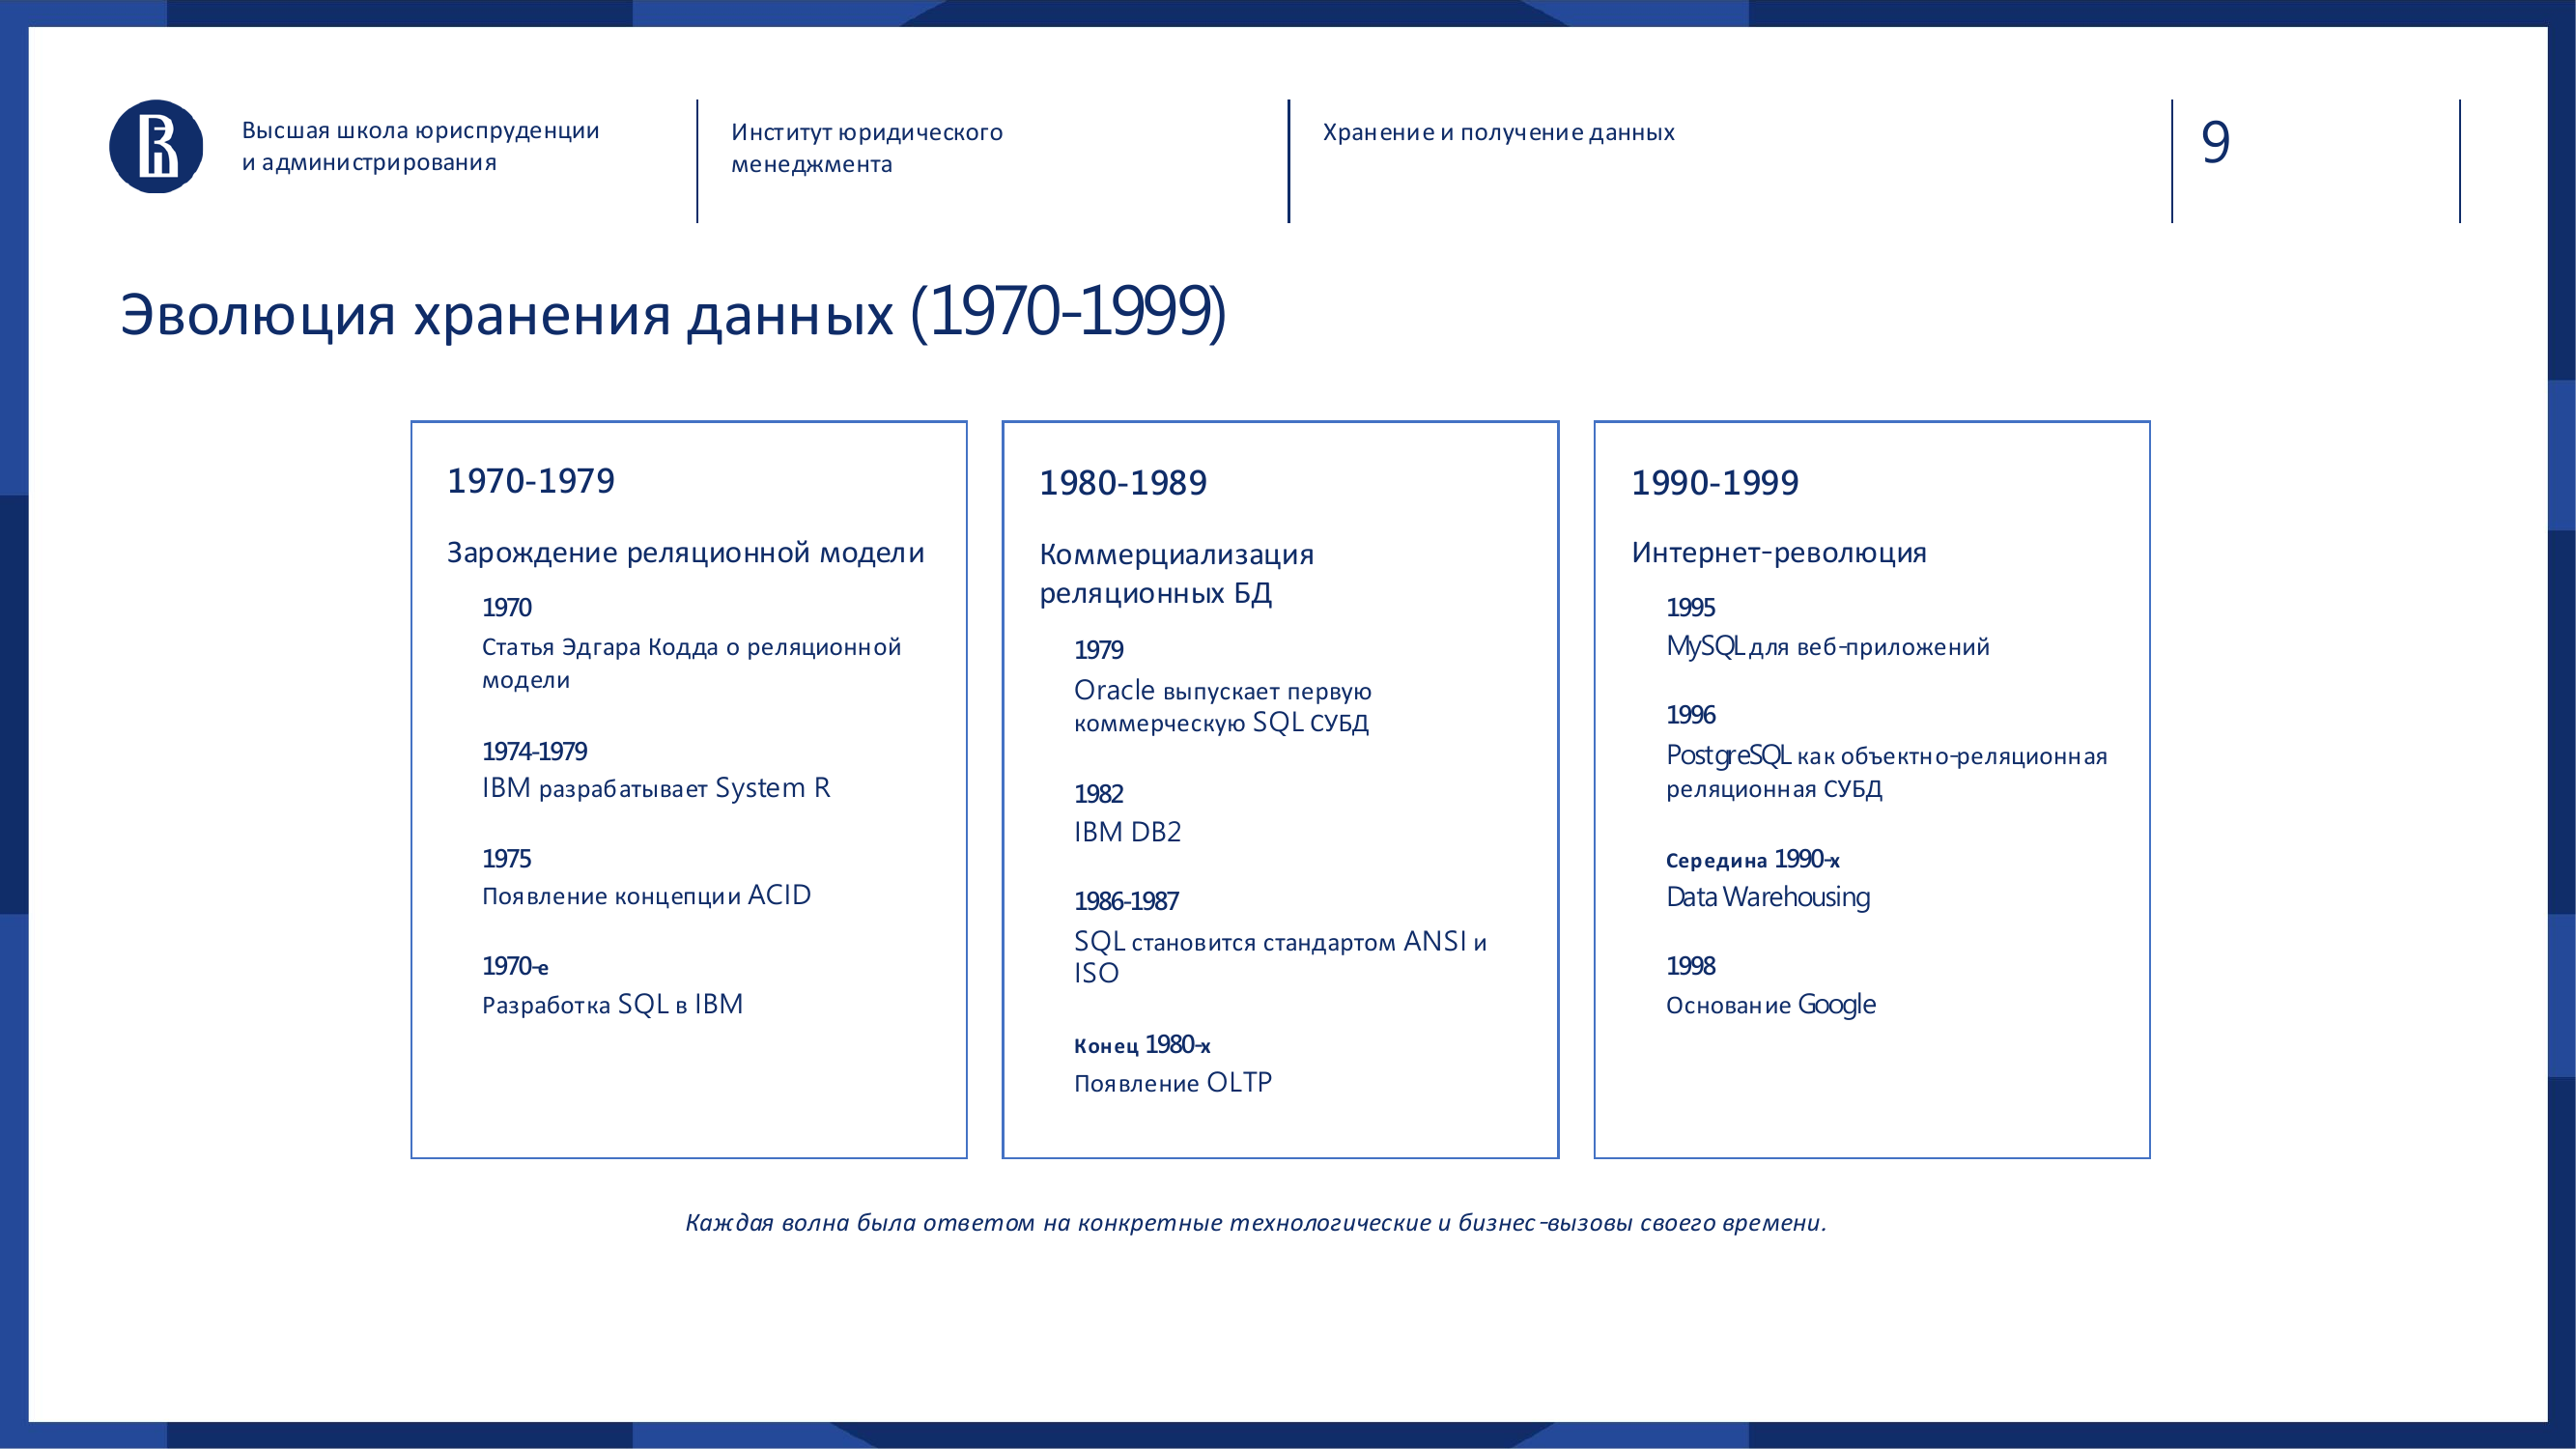
To understand modern data architecture, it helps to look at how we got here.
| Period | What happened | Key technologies | |---|---|---| | 1970s | Edgar Codd proposed the relational model: tables, rows, columns and relationships | Relational theory, SQL | | 1980s | Relational DBMS became the commercial standard | Oracle, IBM DB2, SQL standardization | | 1990s | The internet increased scale. OLAP and data warehouses appeared | MySQL, PostgreSQL, DWH, OLAP | | 2000s | Web-scale companies reached the limits of classic DBMS | MapReduce, BigTable, Dynamo | | 2007-2012 | The NoSQL revolution responded to new data types and horizontal scaling | MongoDB, Cassandra, Redis, CouchDB | | 2013-2018 | Clouds and managed services made storage and processing easier | Cloud-native DWH, Spark, Kafka, Airflow | | 2019-2024 | Lakehouse combined Lake flexibility with Warehouse structure. AI created demand for vector DBMS | Lakehouse, vector DBMS, RAG |
The main conclusion from this history is simple:
each new wave of technology appeared not because older technologies became bad, but because tasks changed.
There is no single database “for everything”. There are different classes of tasks, and they need different solutions.
---
Data types: not all data is the same
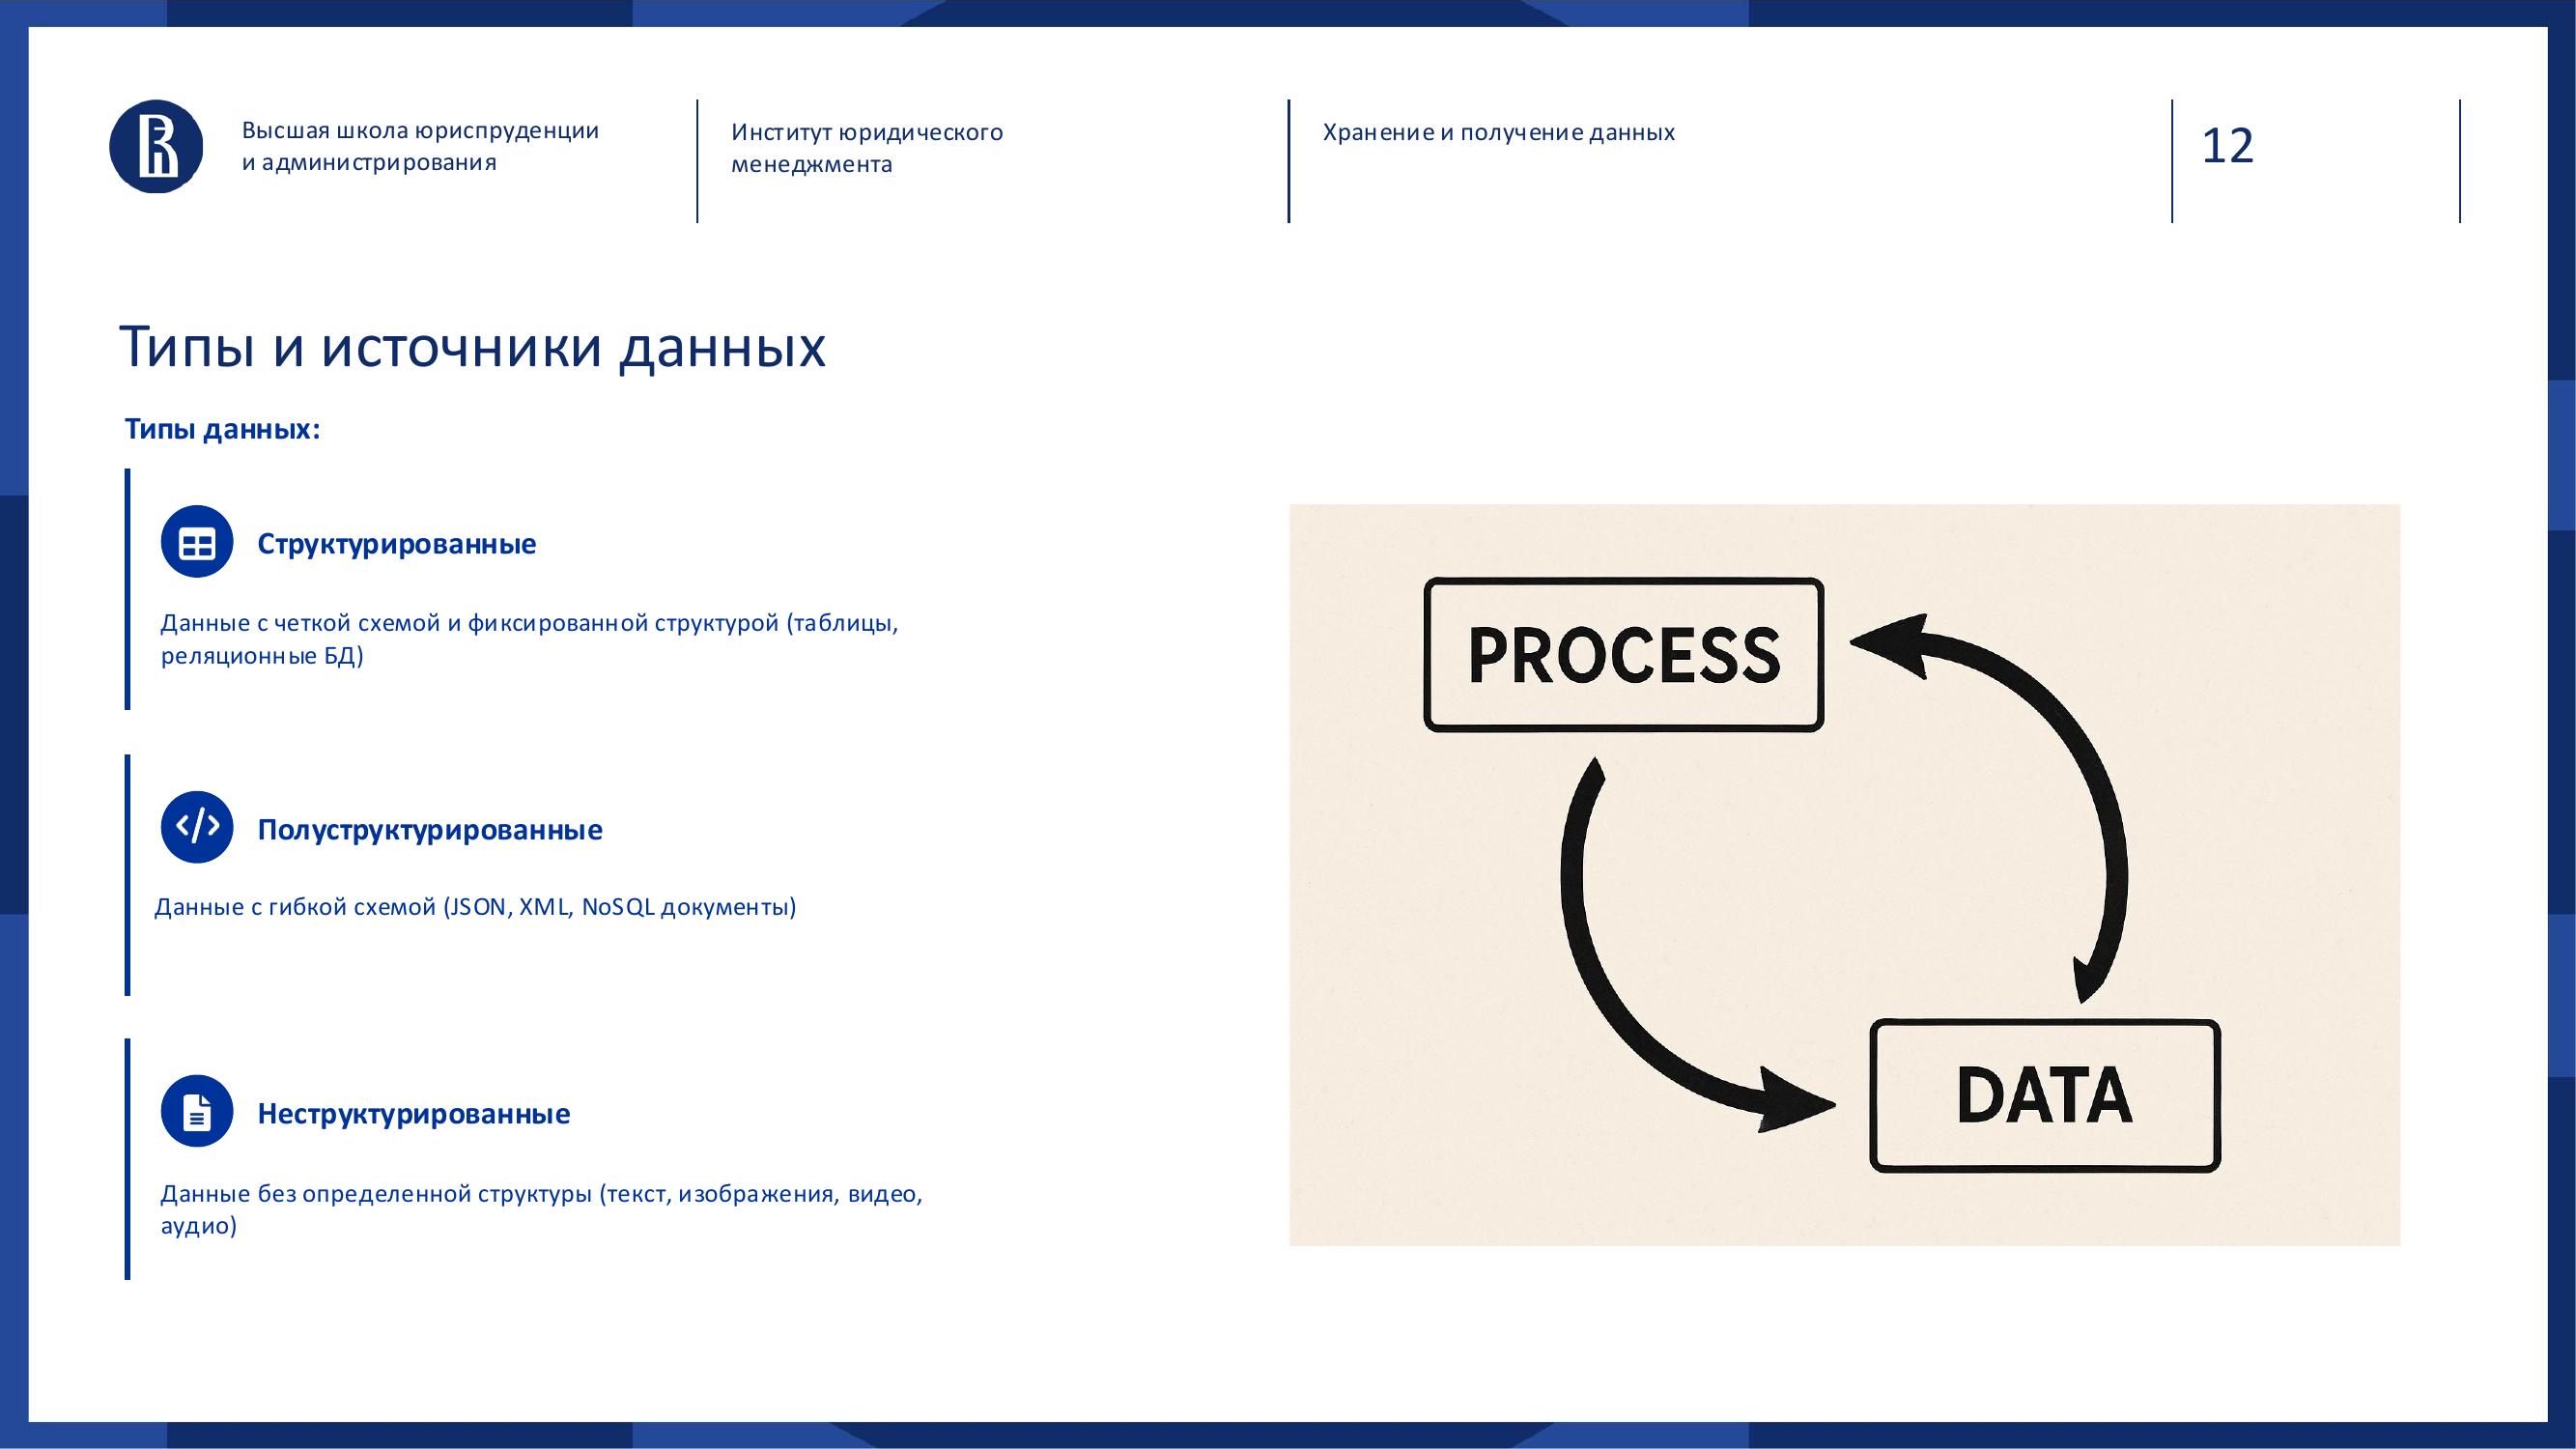
Before we talk about databases and architectures, we need to understand the data itself.
It is common to distinguish three large types:
- structured;
- semi-structured;
- unstructured.
### Structured data 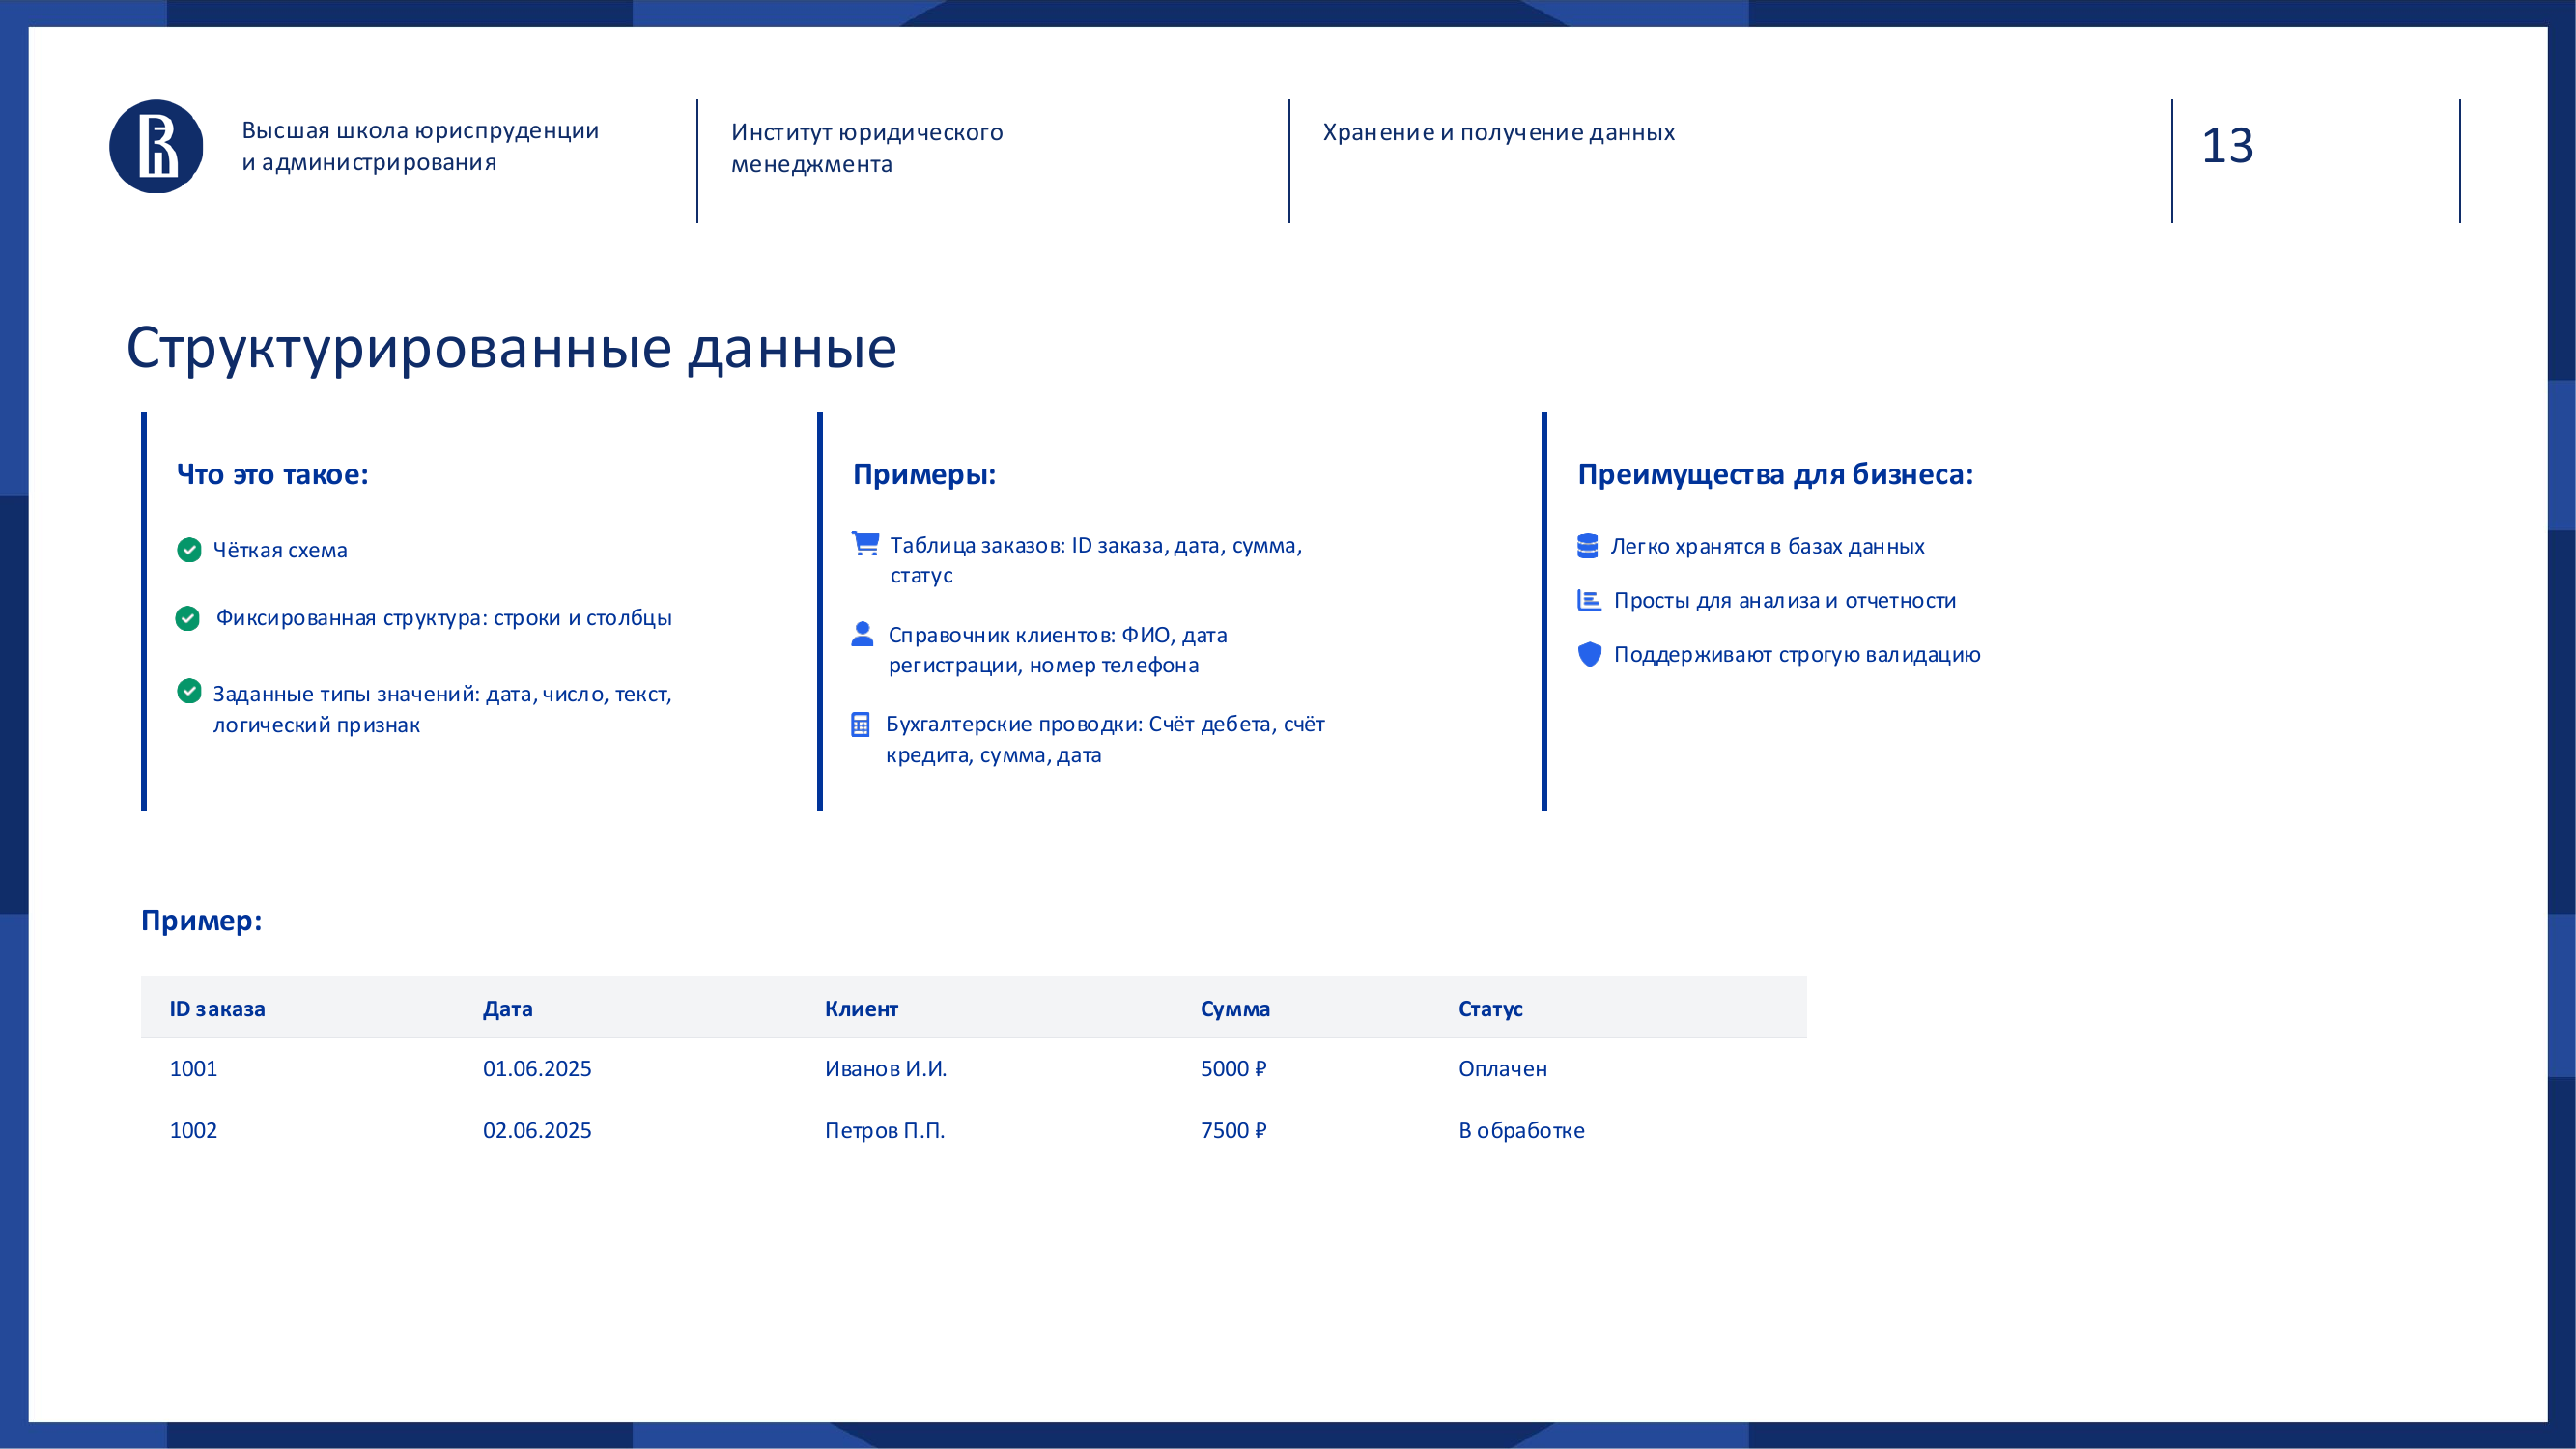
Structured data is the most familiar format.
Imagine an Excel table:
- each row is a separate record;
- each column is a clear field;
- each field has a type: date, number, text, status, amount.
Examples:
- an orders table;
- a customer directory;
- accounting entries;
- warehouse balances;
- payments;
- shift schedules.
This data fits well into relational databases. It is convenient to validate, analyze, aggregate and use in reporting.
The main advantage of structured data is predictability.
If a field is called order_date, it is clear that it should contain the order date. If a field is called amount, it is expected to contain an amount. If a field is called status, it should contain a status from a limited set of values.
For management reporting, this is the foundation.
### Semi-structured data 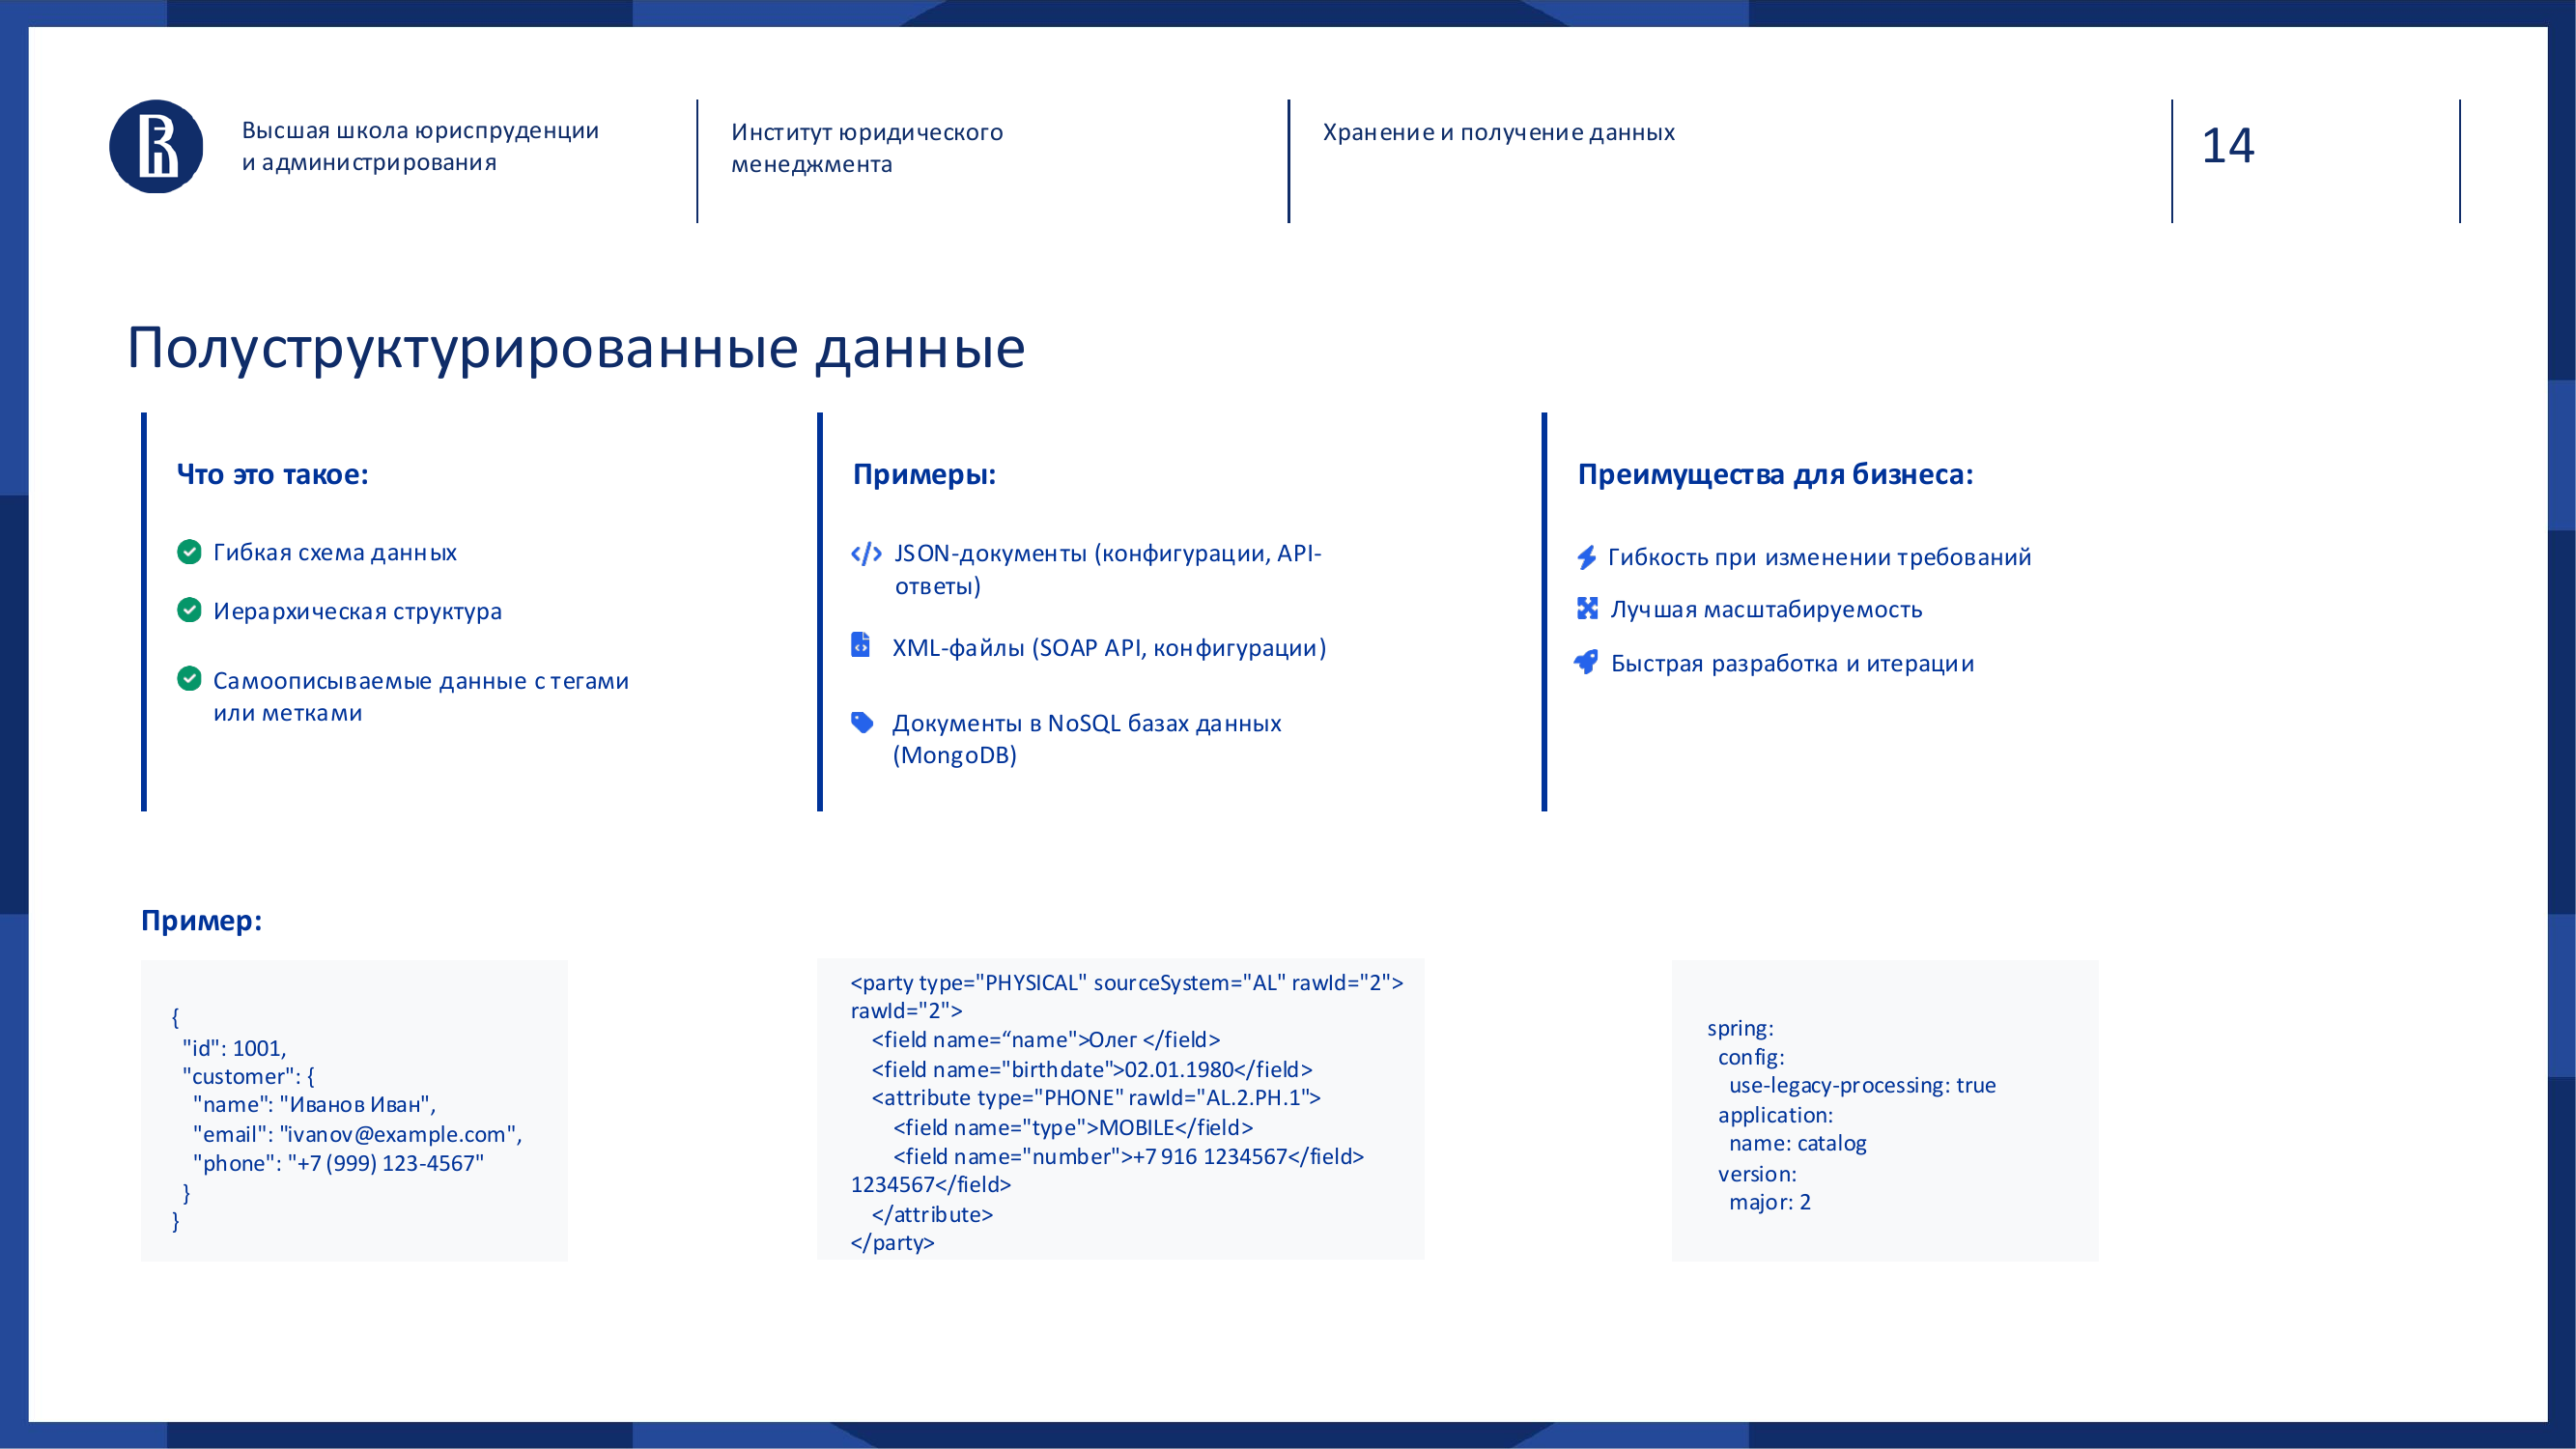
Semi-structured data is no longer a strict table, but it is not complete chaos either.
Usually this means JSON, XML, YAML, events, API responses and logs.
Such data has internal structure, but it can be flexible. One object contains one set of fields, another object contains another. Nesting can change. Data can come from an external service, a mobile app, a web system or an IoT device.
Analogy: if structured data is a strict questionnaire where every field is required, semi-structured data is a questionnaire with “depends on the case” sections.
One customer has a phone and email. Another has a phone, email, Telegram and order history. A third has only an identifier from an external system.
Semi-structured data is very important for modern integrations. Most APIs and event-driven systems work this way.
### Unstructured data 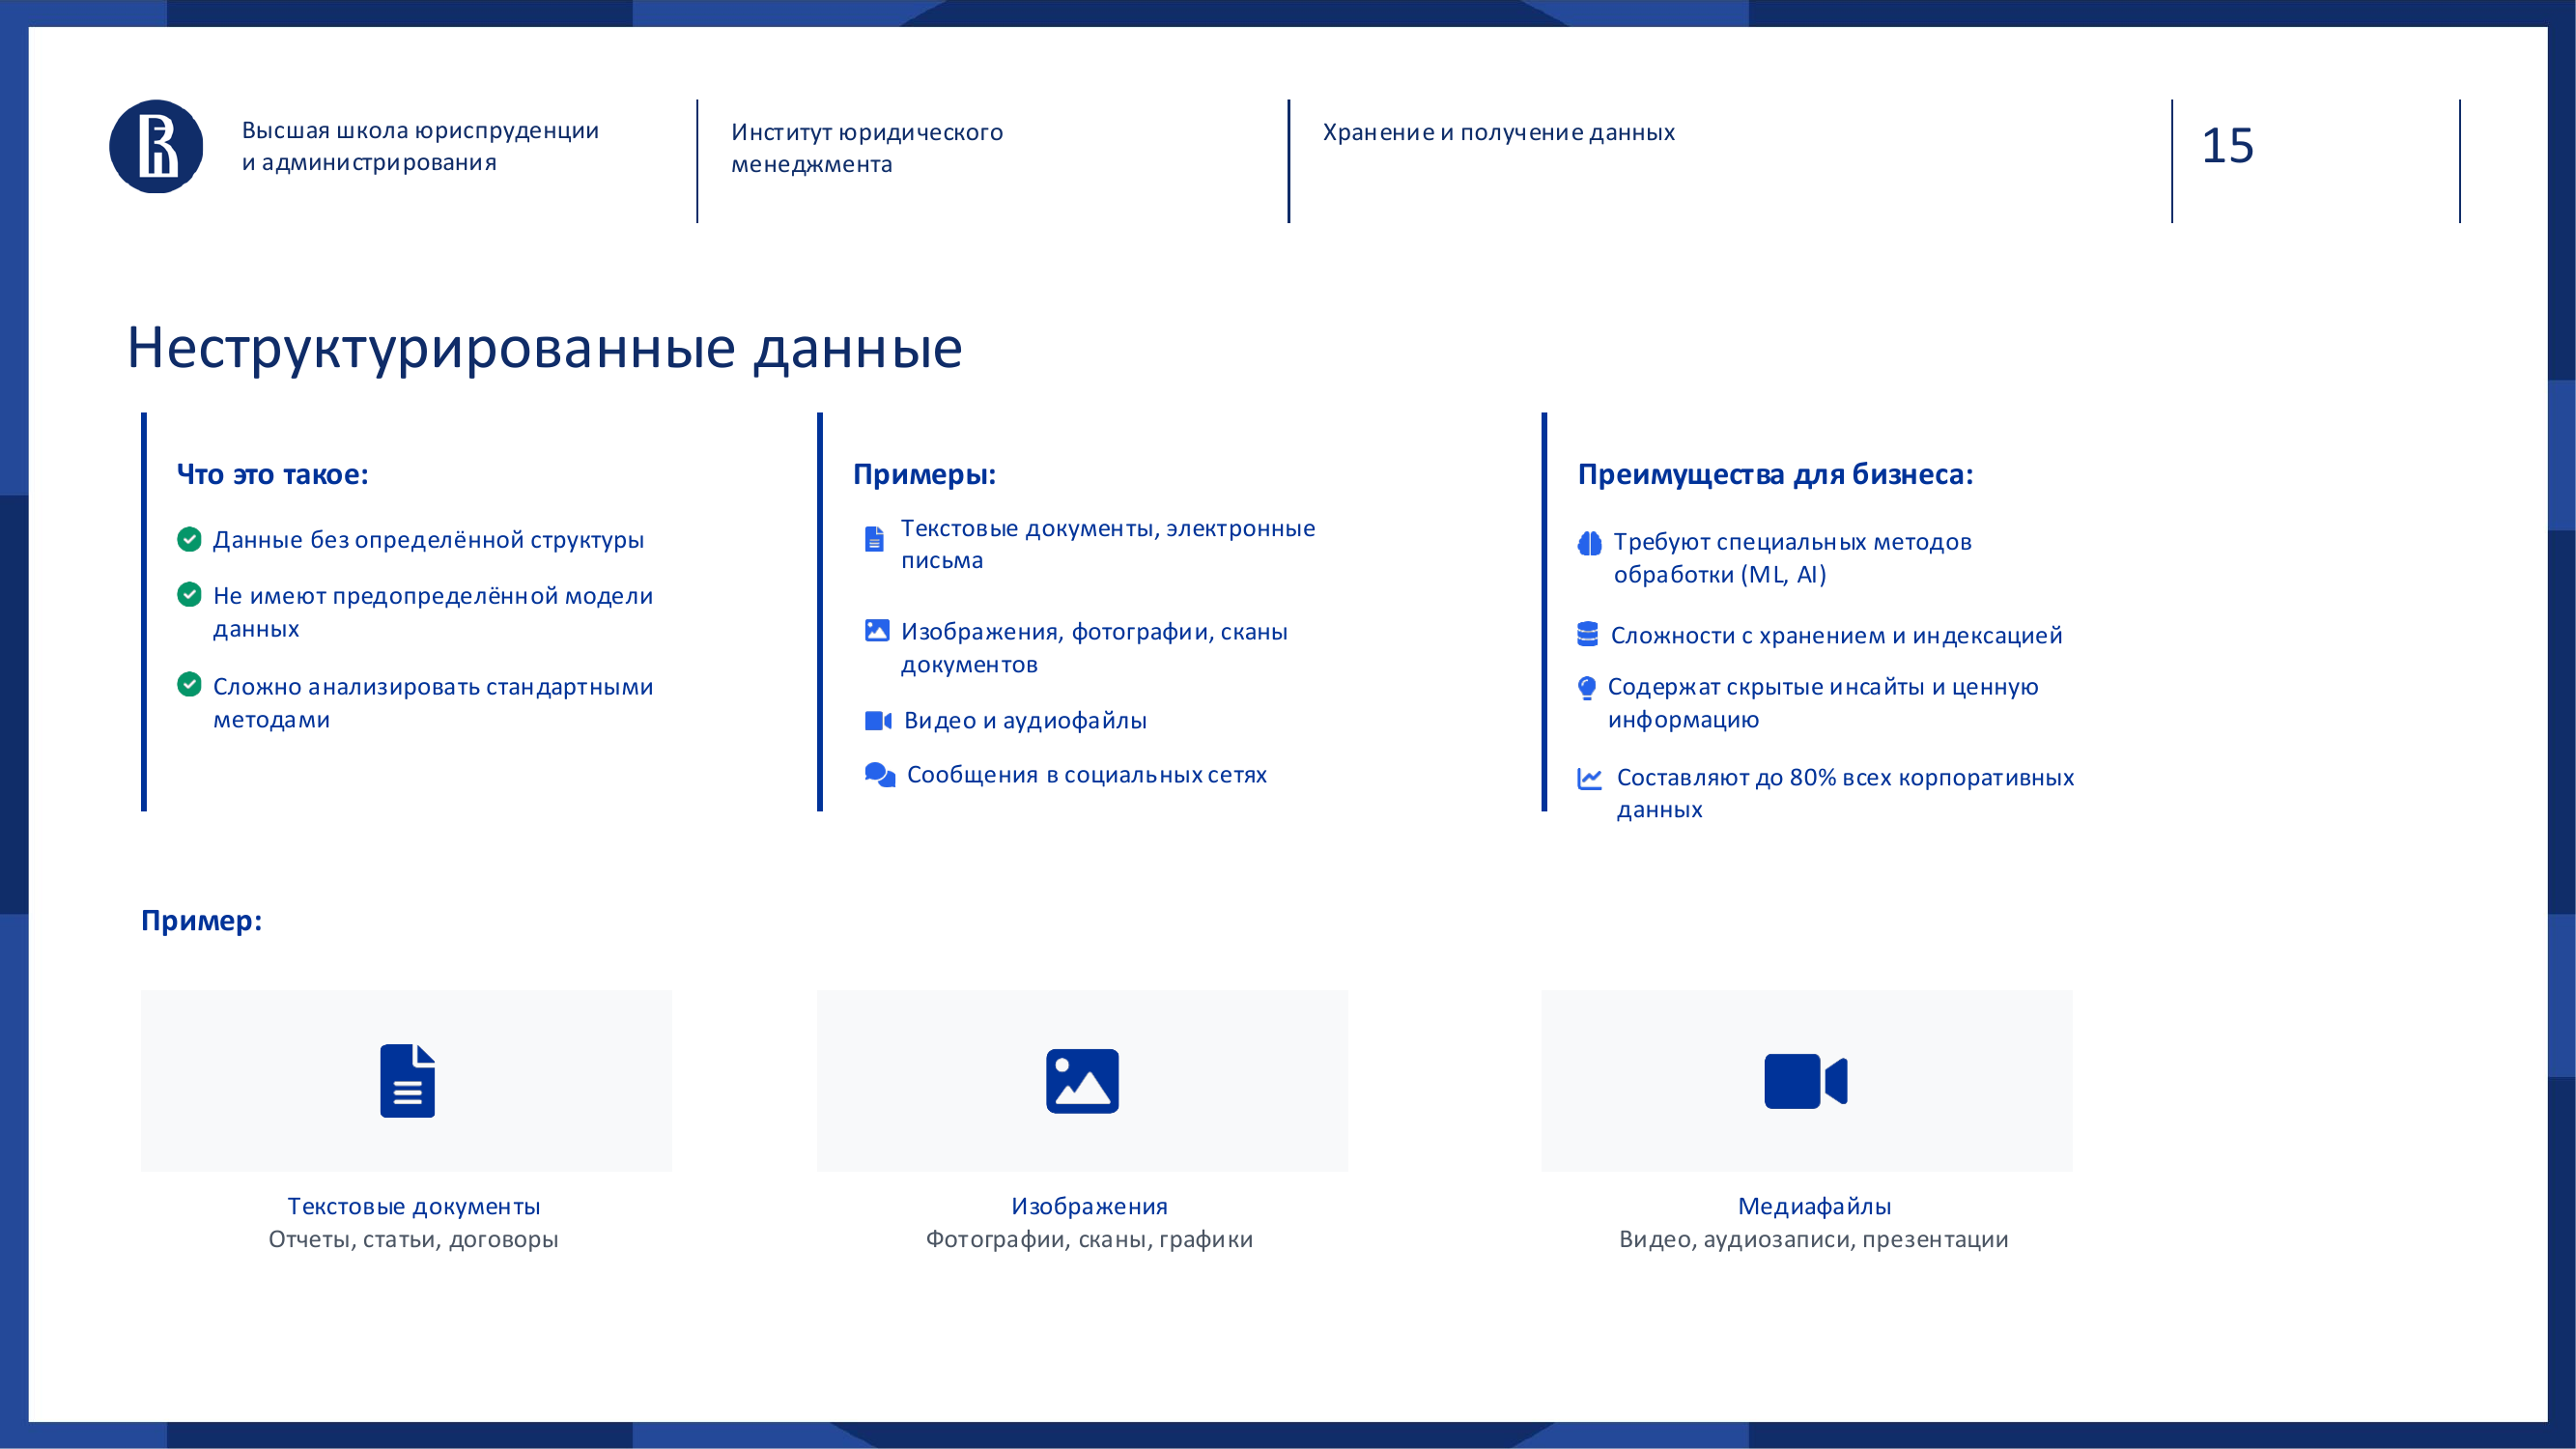
Unstructured data means texts, emails, contracts, scans, images, audio, video, presentations, customer requests and messages.
In other words, everything that does not fit into a simple table.
In the past, such data was often just stored as files. It was important for people, but poorly available for machine processing.
Today the situation has changed. With machine learning, LLMs, OCR, speech-to-text and vector search, unstructured data has become a major source of value.
For example:
- customer requests can be analyzed;
- similar contracts can be found;
- common complaint reasons can be detected;
- internal document search can be built;
- corporate assistants can be created;
- meaning can be extracted from messages and texts.
But there is an important nuance: unstructured data requires special processing methods. A normal table will not help here.
---
Data sources: where everything comes from
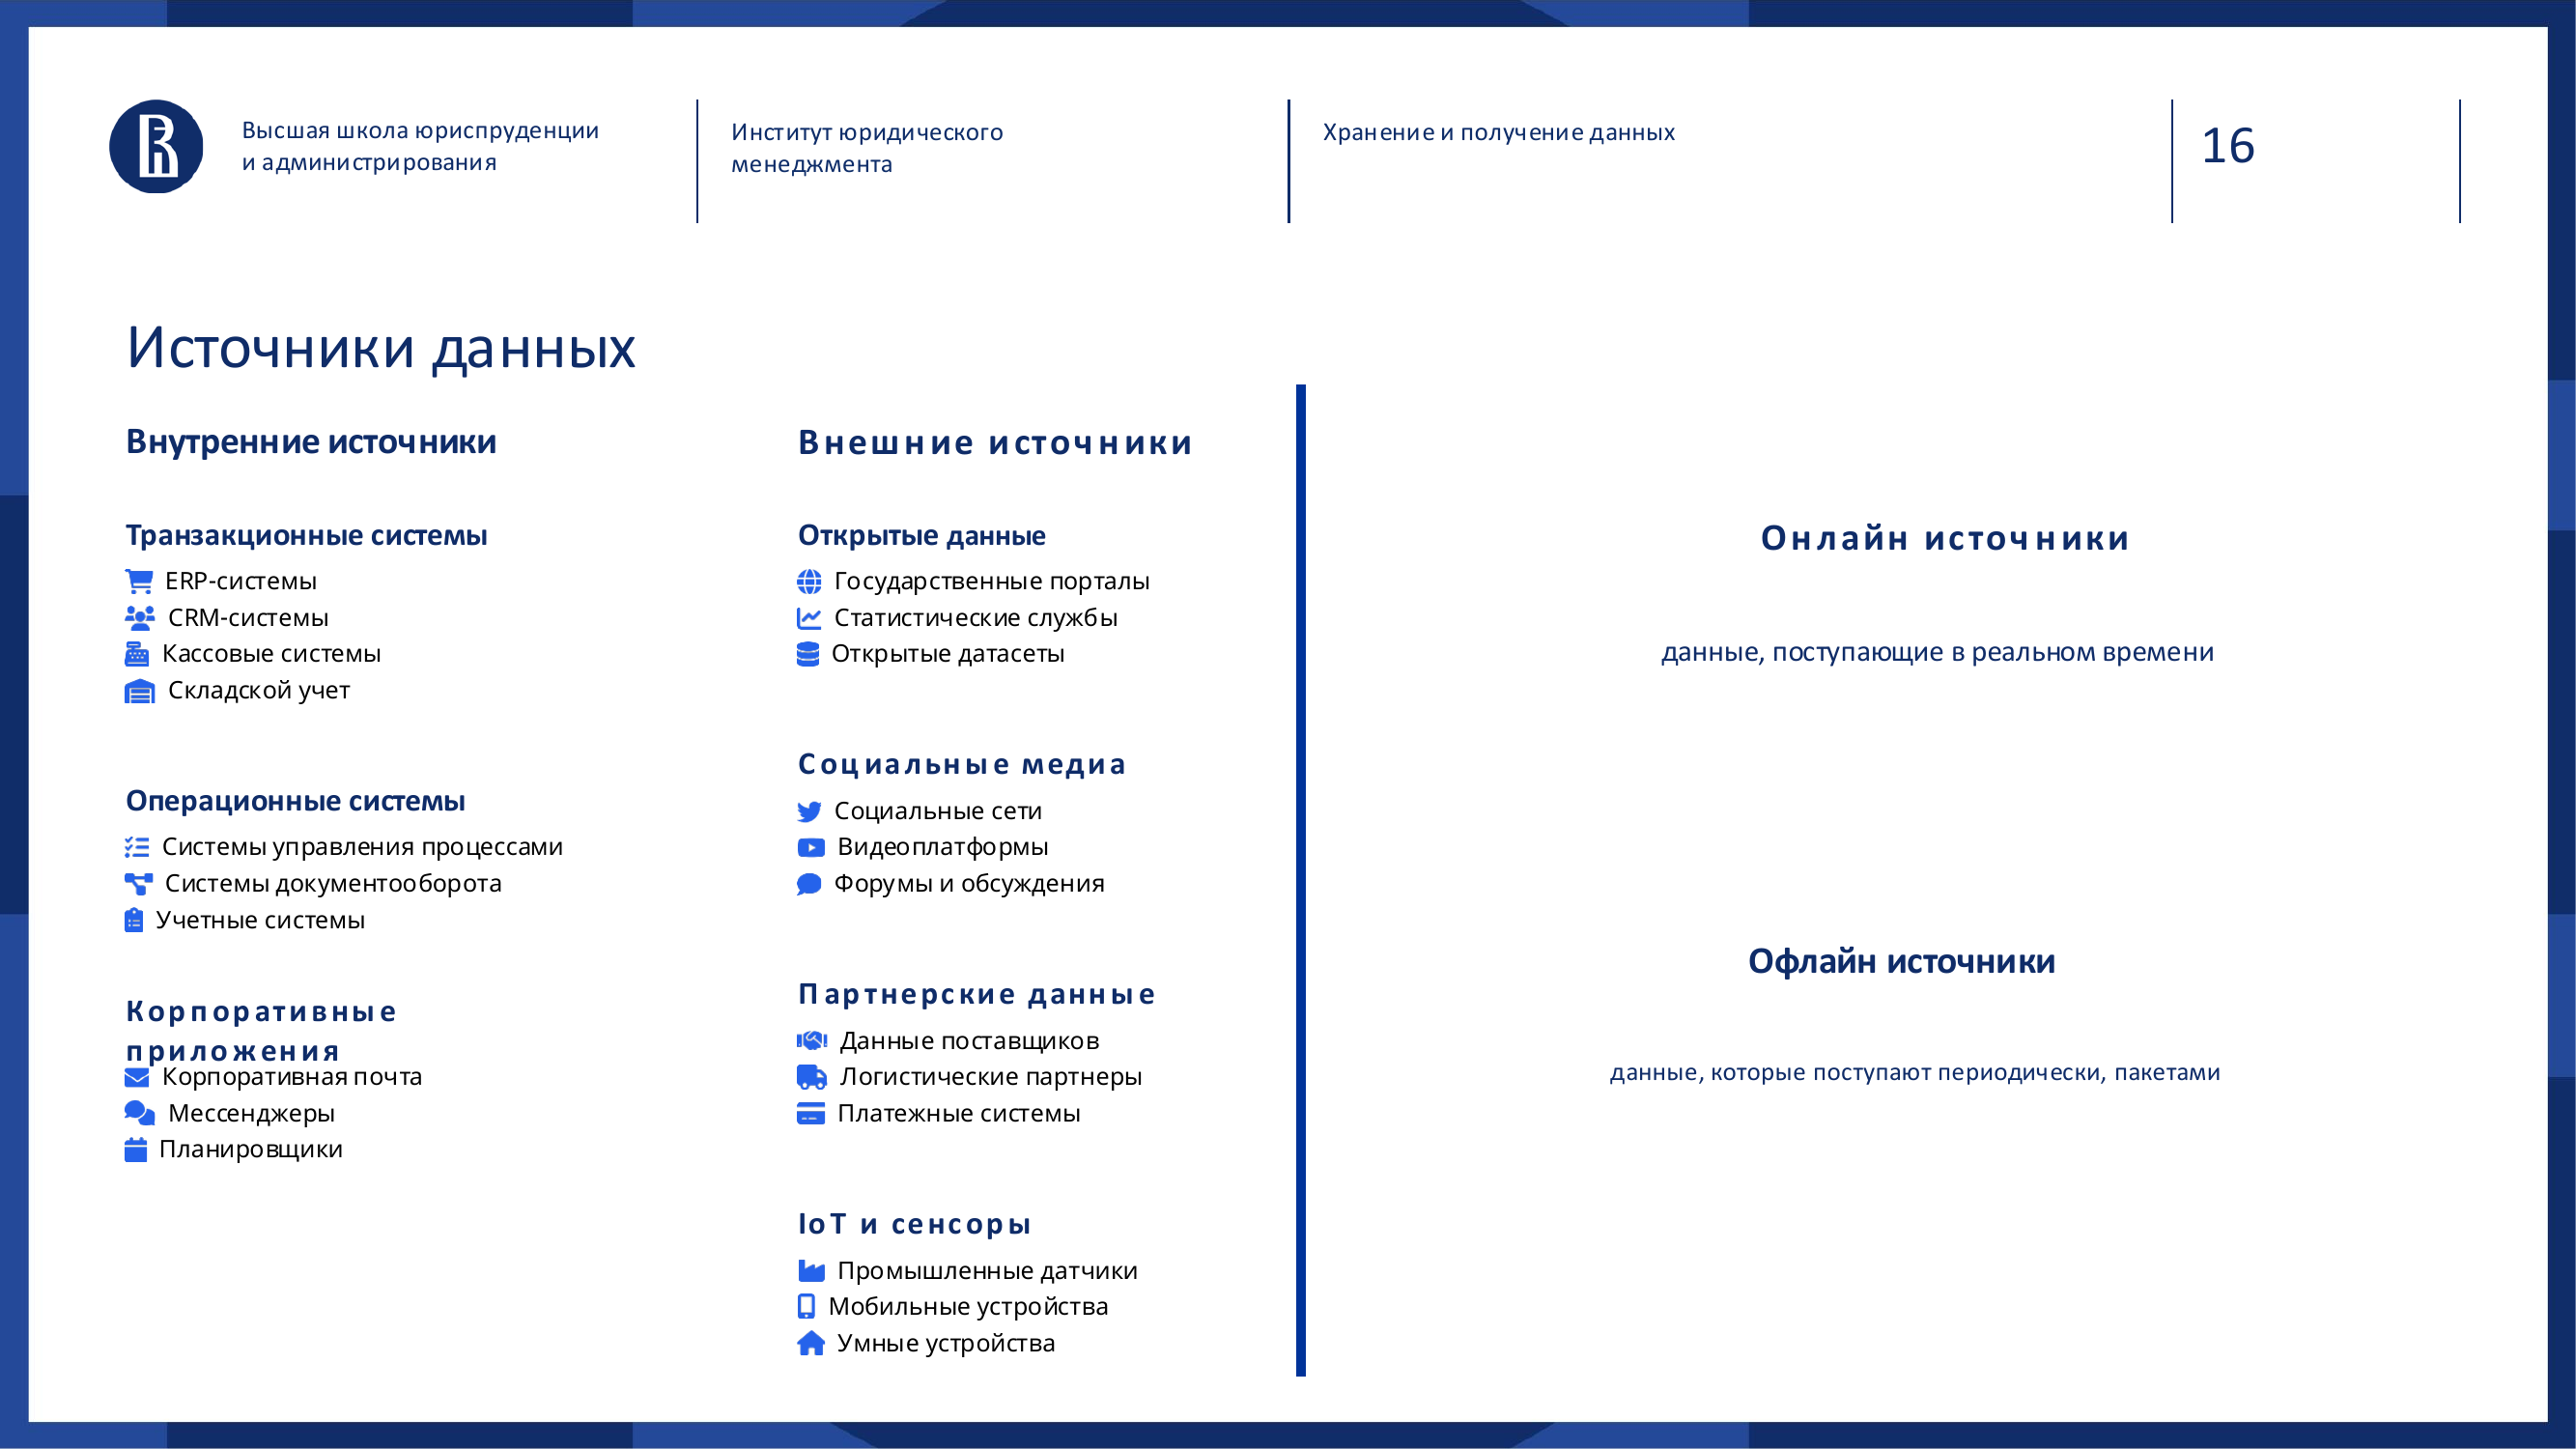
Data does not appear out of thin air. It is born in processes.
There are internal sources:
- CRM;
- ERP;
- accounting systems;
- point-of-sale systems;
- warehouse accounting;
- HR systems;
- document management systems;
- task management systems;
- email;
- messengers;
- company products;
- internal services;
- industrial equipment;
- sensors and devices.
There are external sources:
- government registers;
- open data;
- partner systems;
- suppliers;
- logistics operators;
- payment services;
- social networks;
- external APIs;
- public datasets.
There is another important classification: online and offline.
Online sources provide data almost in real time: clicks, application events, transactions, telemetry.
Offline sources send data periodically: an accounting export once a night, a supplier report once a week, an Excel file from a partner once a month.
For the business, this is not a technical detail. The type of source determines how quickly decisions can be made.
If you manage warehouse balances, a one-day delay may be acceptable. If you manage payment antifraud, a one-day delay turns the system into a museum.
> Questions for a manager > > - Which decisions in your function require same-day data? > - Where is weekly or monthly frequency enough? > - Which sources are currently treated as external, but actually affect daily decisions?
---
Why “put everything in one place” is harder than it sounds
At the idea level, everything looks simple:
- we have data in different systems;
- let's collect it in one storage layer;
- build reports;
- start making decisions.
In reality, the fun begins.
### Different formats
One system returns tables. Another returns JSON. A third returns XML. A fourth returns PDF. A fifth returns an archive of files. A sixth returns an event stream.
Before data can be combined, it has to be parsed, brought into a clear form and described.
### Different identifiers
The same customer may have different IDs in CRM, ERP and accounting. The same product may be named differently by warehouse, procurement and marketing.
Until there is a shared master data logic, the company cannot confidently say that it sees the same object.
### Different accounting rules
In one system, the amount includes VAT. In another, it excludes VAT. Somewhere the date means the order creation date. Somewhere it means the payment date. Somewhere it means the shipment date.
Formally, the fields look similar. Semantically, they are different.
This is exactly where reports that argue with each other are born.
### Different update frequency
CRM updates constantly. The accounting system exports at night. A partner sends a file once a week. An external API is sometimes unavailable.
If this is ignored, analytics will show strange results. Not because the system is broken, but because data lives in different rhythms.
### Access rights and security
Not all data can simply be taken and moved. There is personal data, trade secrets, regulatory requirements and internal security policies.
Working with data is not only about technology. It is also about responsibility.
---
ETL, ELT and CDC: how data moves between systems
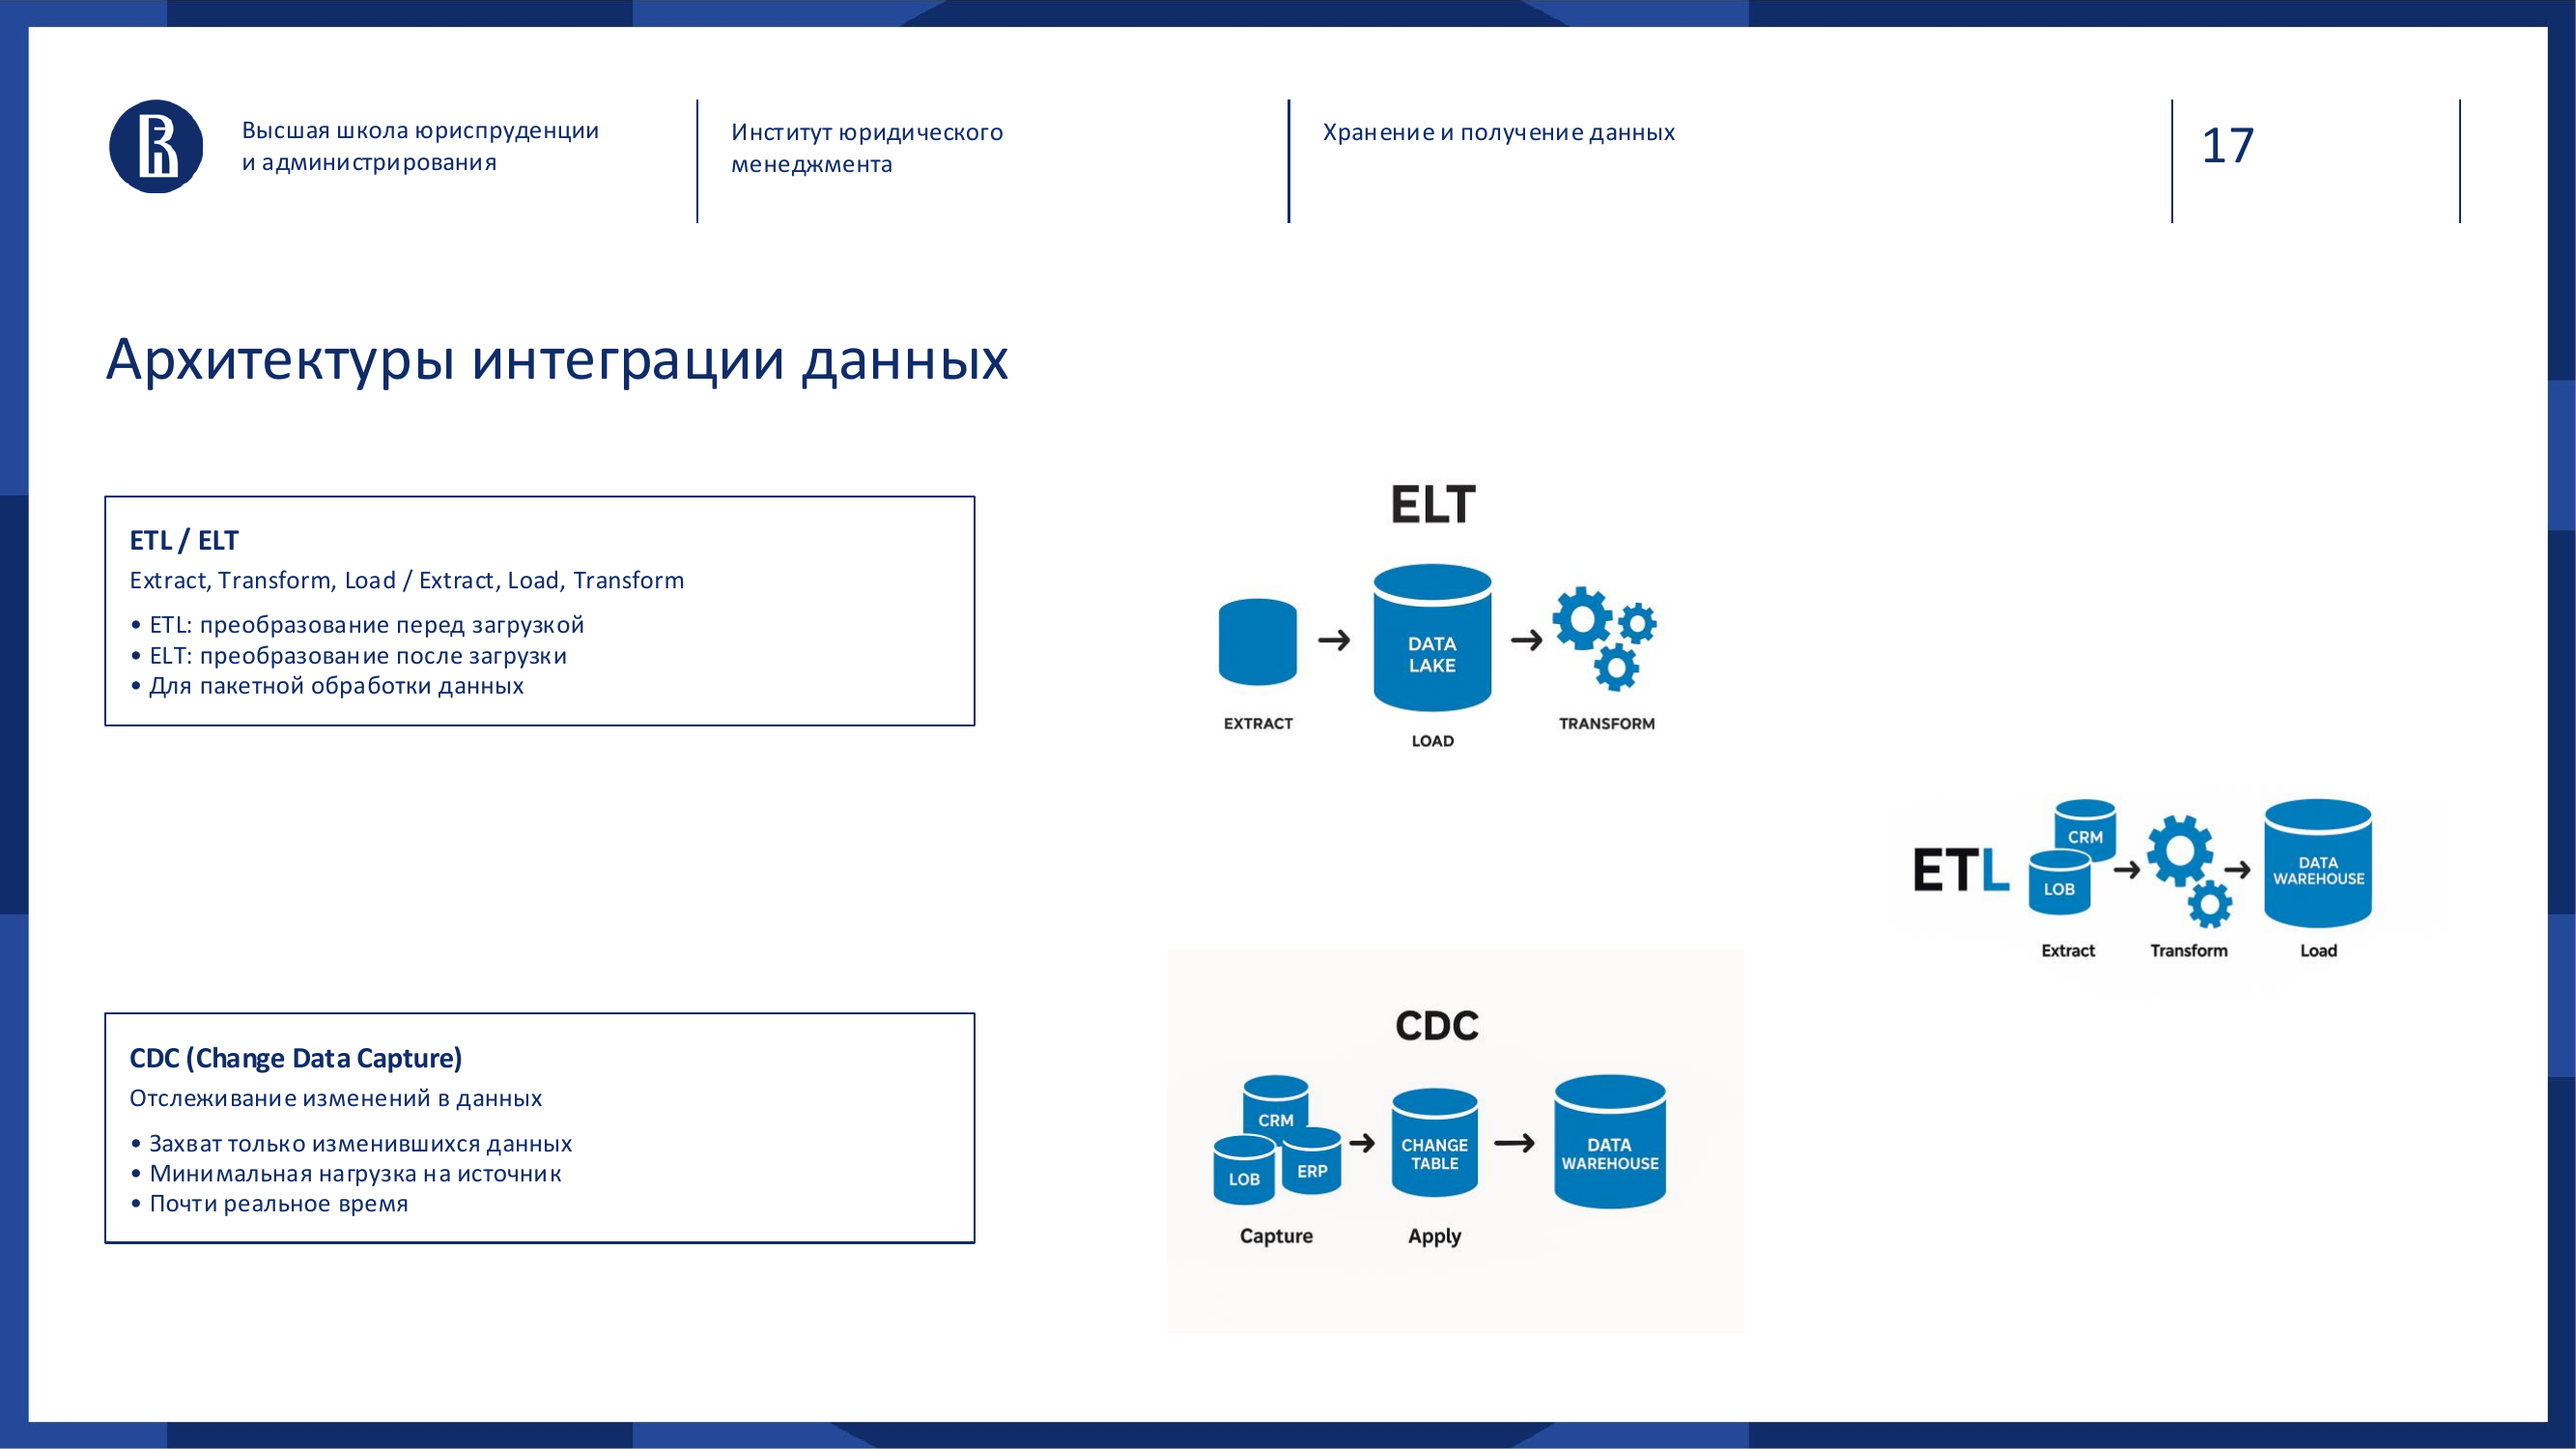
For data from different sources to reach storage, integration is needed.
There are three approaches a manager should know: ETL, ELT and CDC.
### ETL: Extract, Transform, Load
ETL means:
- Extract, take data from the source;
- Transform, convert it;
- Load, put it into storage.
First the data is taken from the source, then cleaned, normalized and brought to the required structure, and only after that loaded into storage.
Analogy: an accountant first collects primary documents, checks them, fixes errors, brings them to one format and only then prepares the final report.
The advantage of ETL is quality control before loading. The drawback is that the process can be slow and less flexible.
ETL is well suited to classic reporting and situations where strict data preparation matters.
### ELT: Extract, Load, Transform
ELT changes the order:
1. First we extract. 2. Then we load as is. 3. And transform later inside storage.
Analogy: we put all documents into a large archive, and then sort, clean, group and analyze them inside that archive.
ELT became especially popular with powerful cloud storage and analytical platforms. They let teams load a lot of data quickly, then process it inside the platform.
The advantage of ELT is speed and flexibility. The drawback is that storage must be powerful and well managed, otherwise it becomes a mess.
### CDC: Change Data Capture
CDC is an approach where the system tracks changes in a source and sends only what changed.
You do not need to export the whole customer table every time. It is enough to send new records, updates and deletions.
Analogy: you do not recalculate the whole family budget from zero after each purchase. You simply record the new change.
CDC is useful when data is needed almost in real time and when the source should not be overloaded with constant full exports.
| Approach | What happens first | Strength | Where it fits especially well | |---|---|---|---| | ETL | Data is cleaned before loading | Quality control | Classic reporting and regulated metrics | | ELT | Data is loaded as is | Speed and flexibility | Cloud storage, analytical platforms, fast experiments | | CDC | Only changes are sent | Near real-time behavior | Events, transactions, operational synchronization |
> The main point is not the name of the approach, but the management rhythm it supports: a monthly report, a report every morning or a reaction almost immediately.
---
OLTP and OLAP: why one database is usually not enough
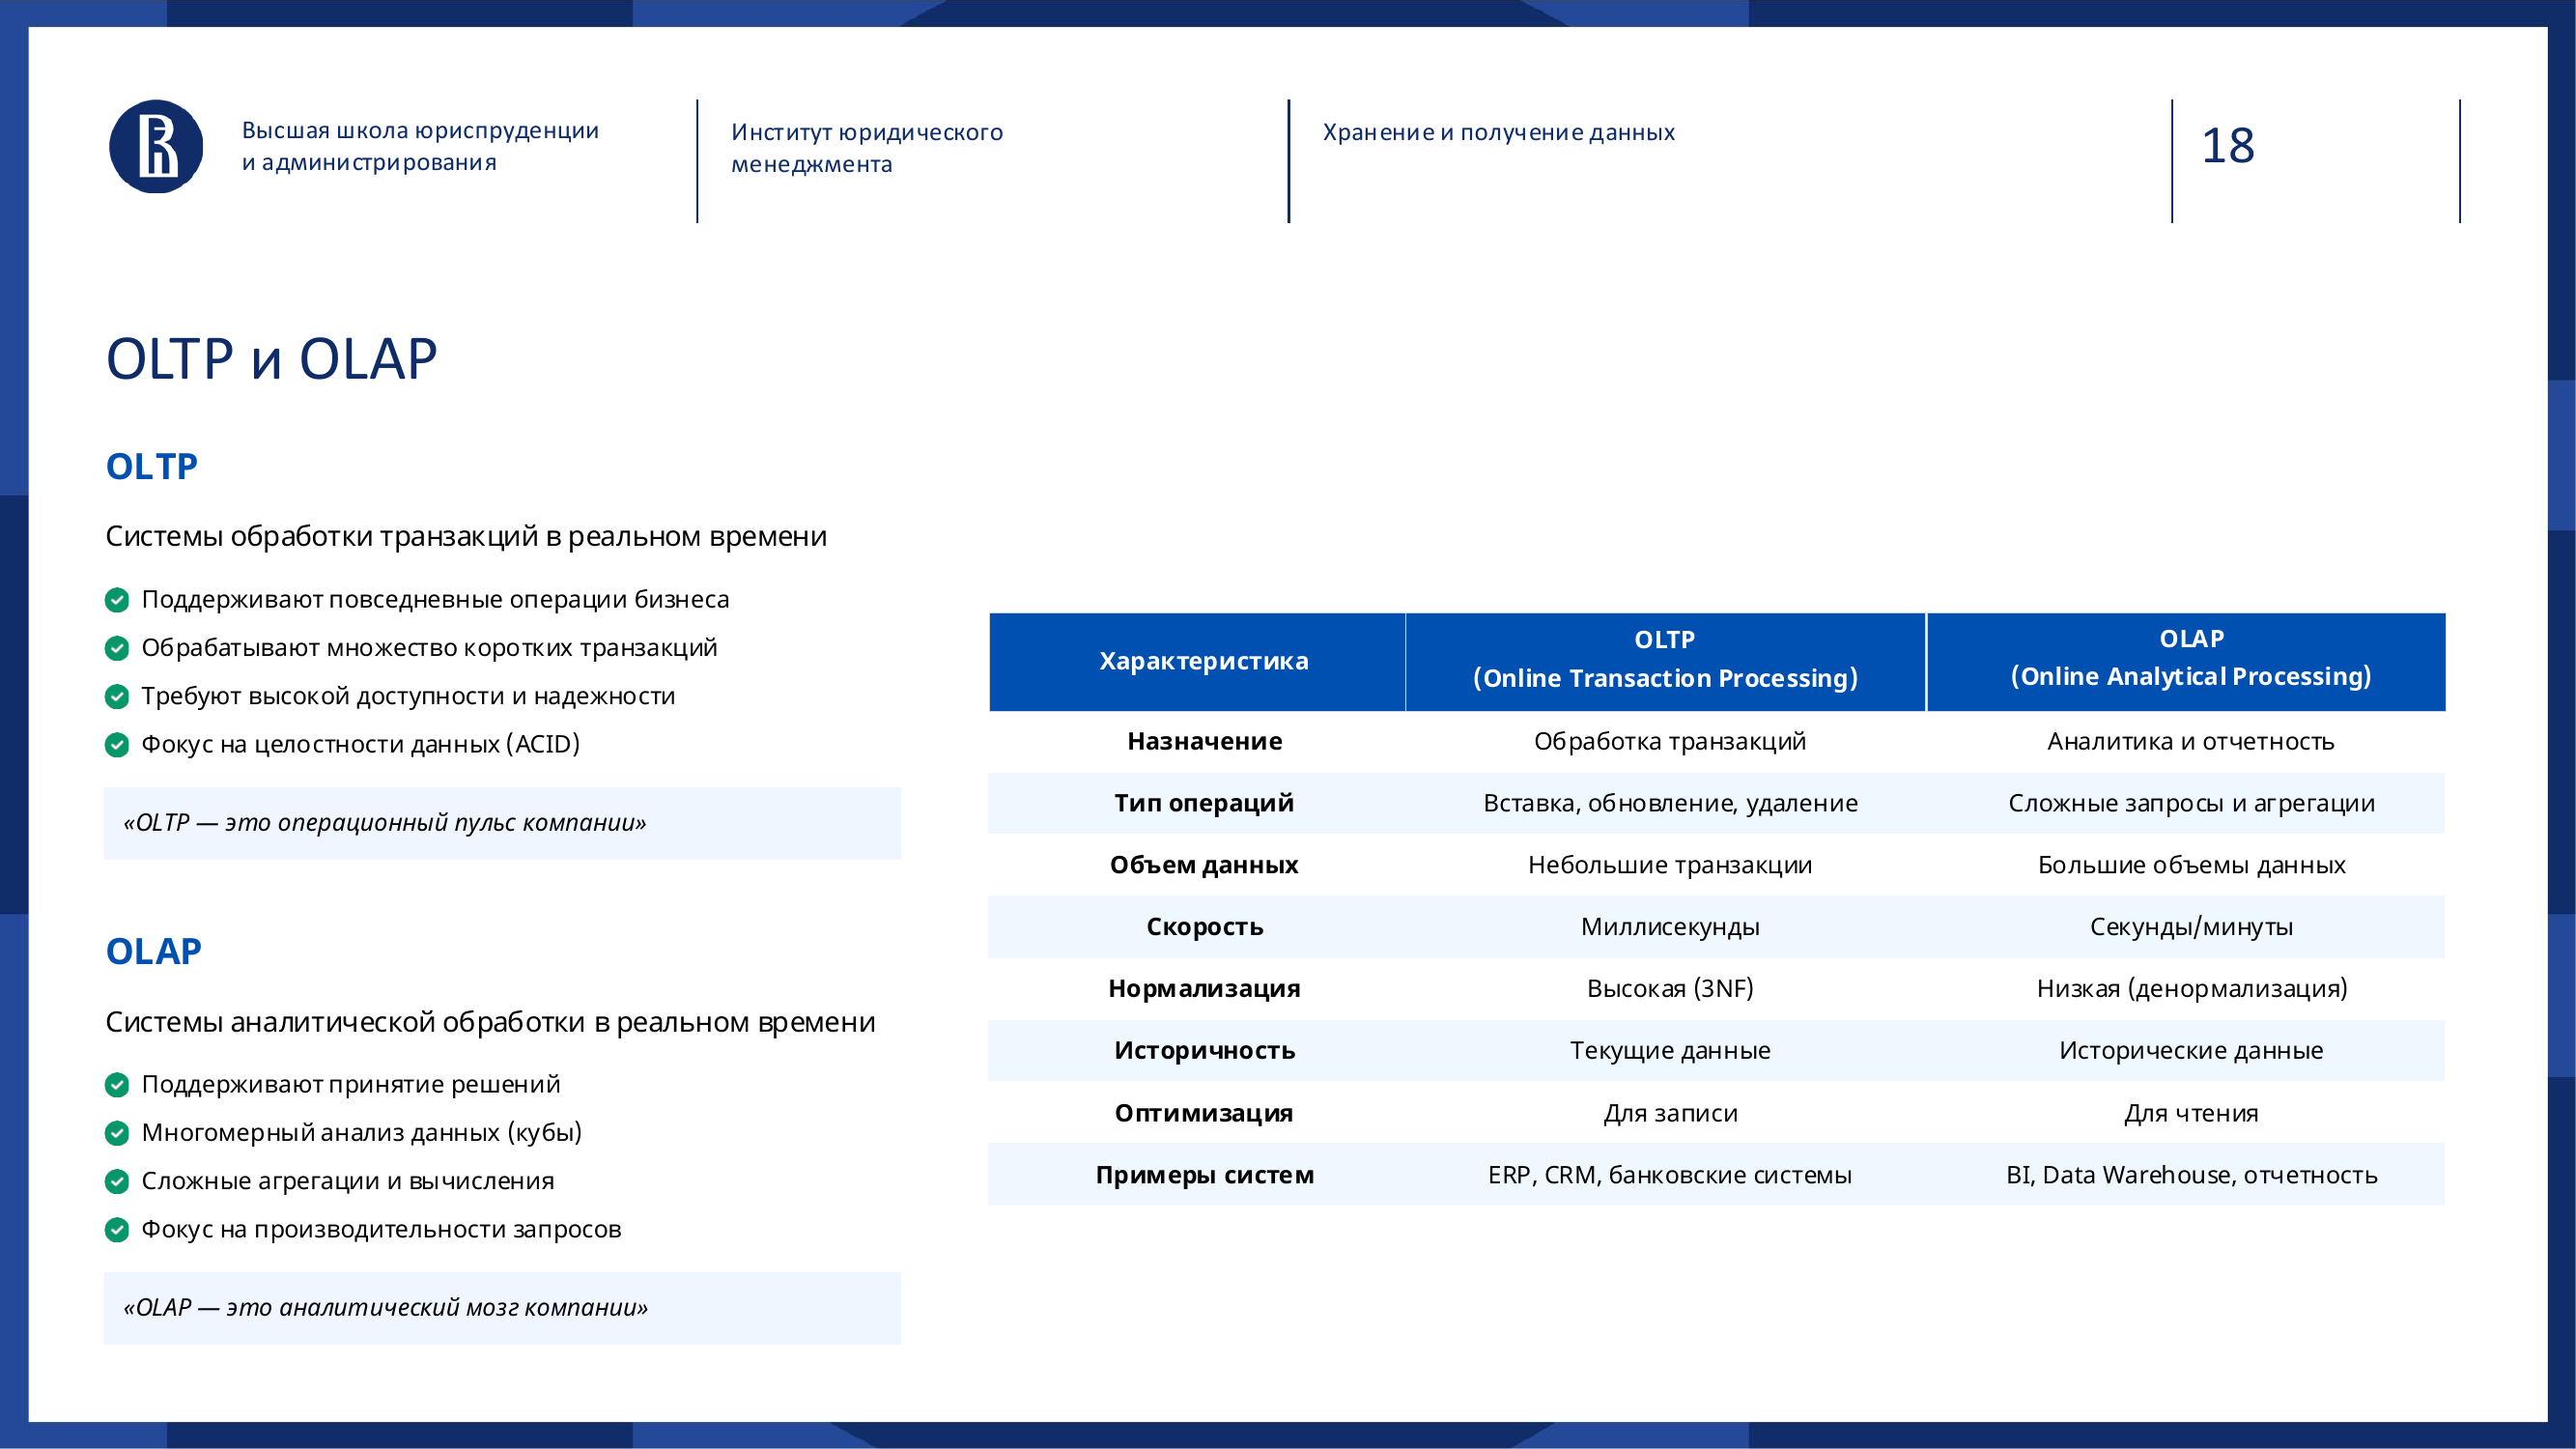
When people say “database”, they often imagine one universal place where you can write operations, build reports and run analytics.
In reality, there are two different classes of tasks: OLTP and OLAP.
### OLTP: the operational pulse of the company
OLTP means Online Transaction Processing.
These systems support daily business operations:
- create an order;
- process a payment;
- write off inventory;
- change a request status;
- register a customer;
- process a transaction.
OLTP systems must be fast, accurate and reliable.
Analogy: a cash register in a store. A customer scans goods, pays and receives a receipt. The system must immediately decrease stock, record payment and avoid mistakes.
If money is charged but the order is not created, that is a problem. If an item is sold twice while only one unit was in stock, that is a problem. If the cash register freezes because of an analytical report, that is a very bad story.
OLTP is about the current state of the business.
### OLAP: the analytical brain of the company
OLAP means Online Analytical Processing.
These are systems for analysis:
- how sales changed by month;
- which regions are growing;
- which products are returned more often;
- how customers behave;
- which channels are more effective;
- where performance deviates from plan.
OLAP works with large volumes of historical data. Aggregations, comparisons, slices and trends matter here.
Analogy: if OLTP is the cash register, OLAP is the finance and analytics department that studies results over a period and helps make strategic decisions.
| Criterion | OLTP | OLAP | |---|---|---| | Main question | What is happening now? | Why did it happen, how did it change and what should we do next? | | Load type | Short operations and frequent writes | Heavy reads, aggregations, historical selections | | Typical example | Order, payment, inventory write-off | Dashboard, forecast, sales analysis | | Risk of mixing | Slower working processes | Low trust in reports and jumping numbers |
### Why you cannot simply do analytics in the working database
Technically, sometimes you can. From a management point of view, it is often risky.
If an analyst runs a heavy query against an operational database, it can slow down the system that serves customers, cash registers, orders or payments.
Also, OLTP changes constantly. While you build a report, data may update. The numbers start to “jump”.
Finally, OLTP and OLAP have different storage structure requirements.
- OLTP is optimized for writes and short operations.
- OLAP is optimized for reads, aggregations and large historical selections.
Trying to make one system perfect for everything is like doing a warehouse audit right at the cash register during rush hour.
> Questions for a manager > > - Which reports are currently built directly from working systems? > - Are there cases where analytics interferes with operations? > - Which metrics should be historical, not only current?
---
DBMS types: why we ended up with a “zoo”
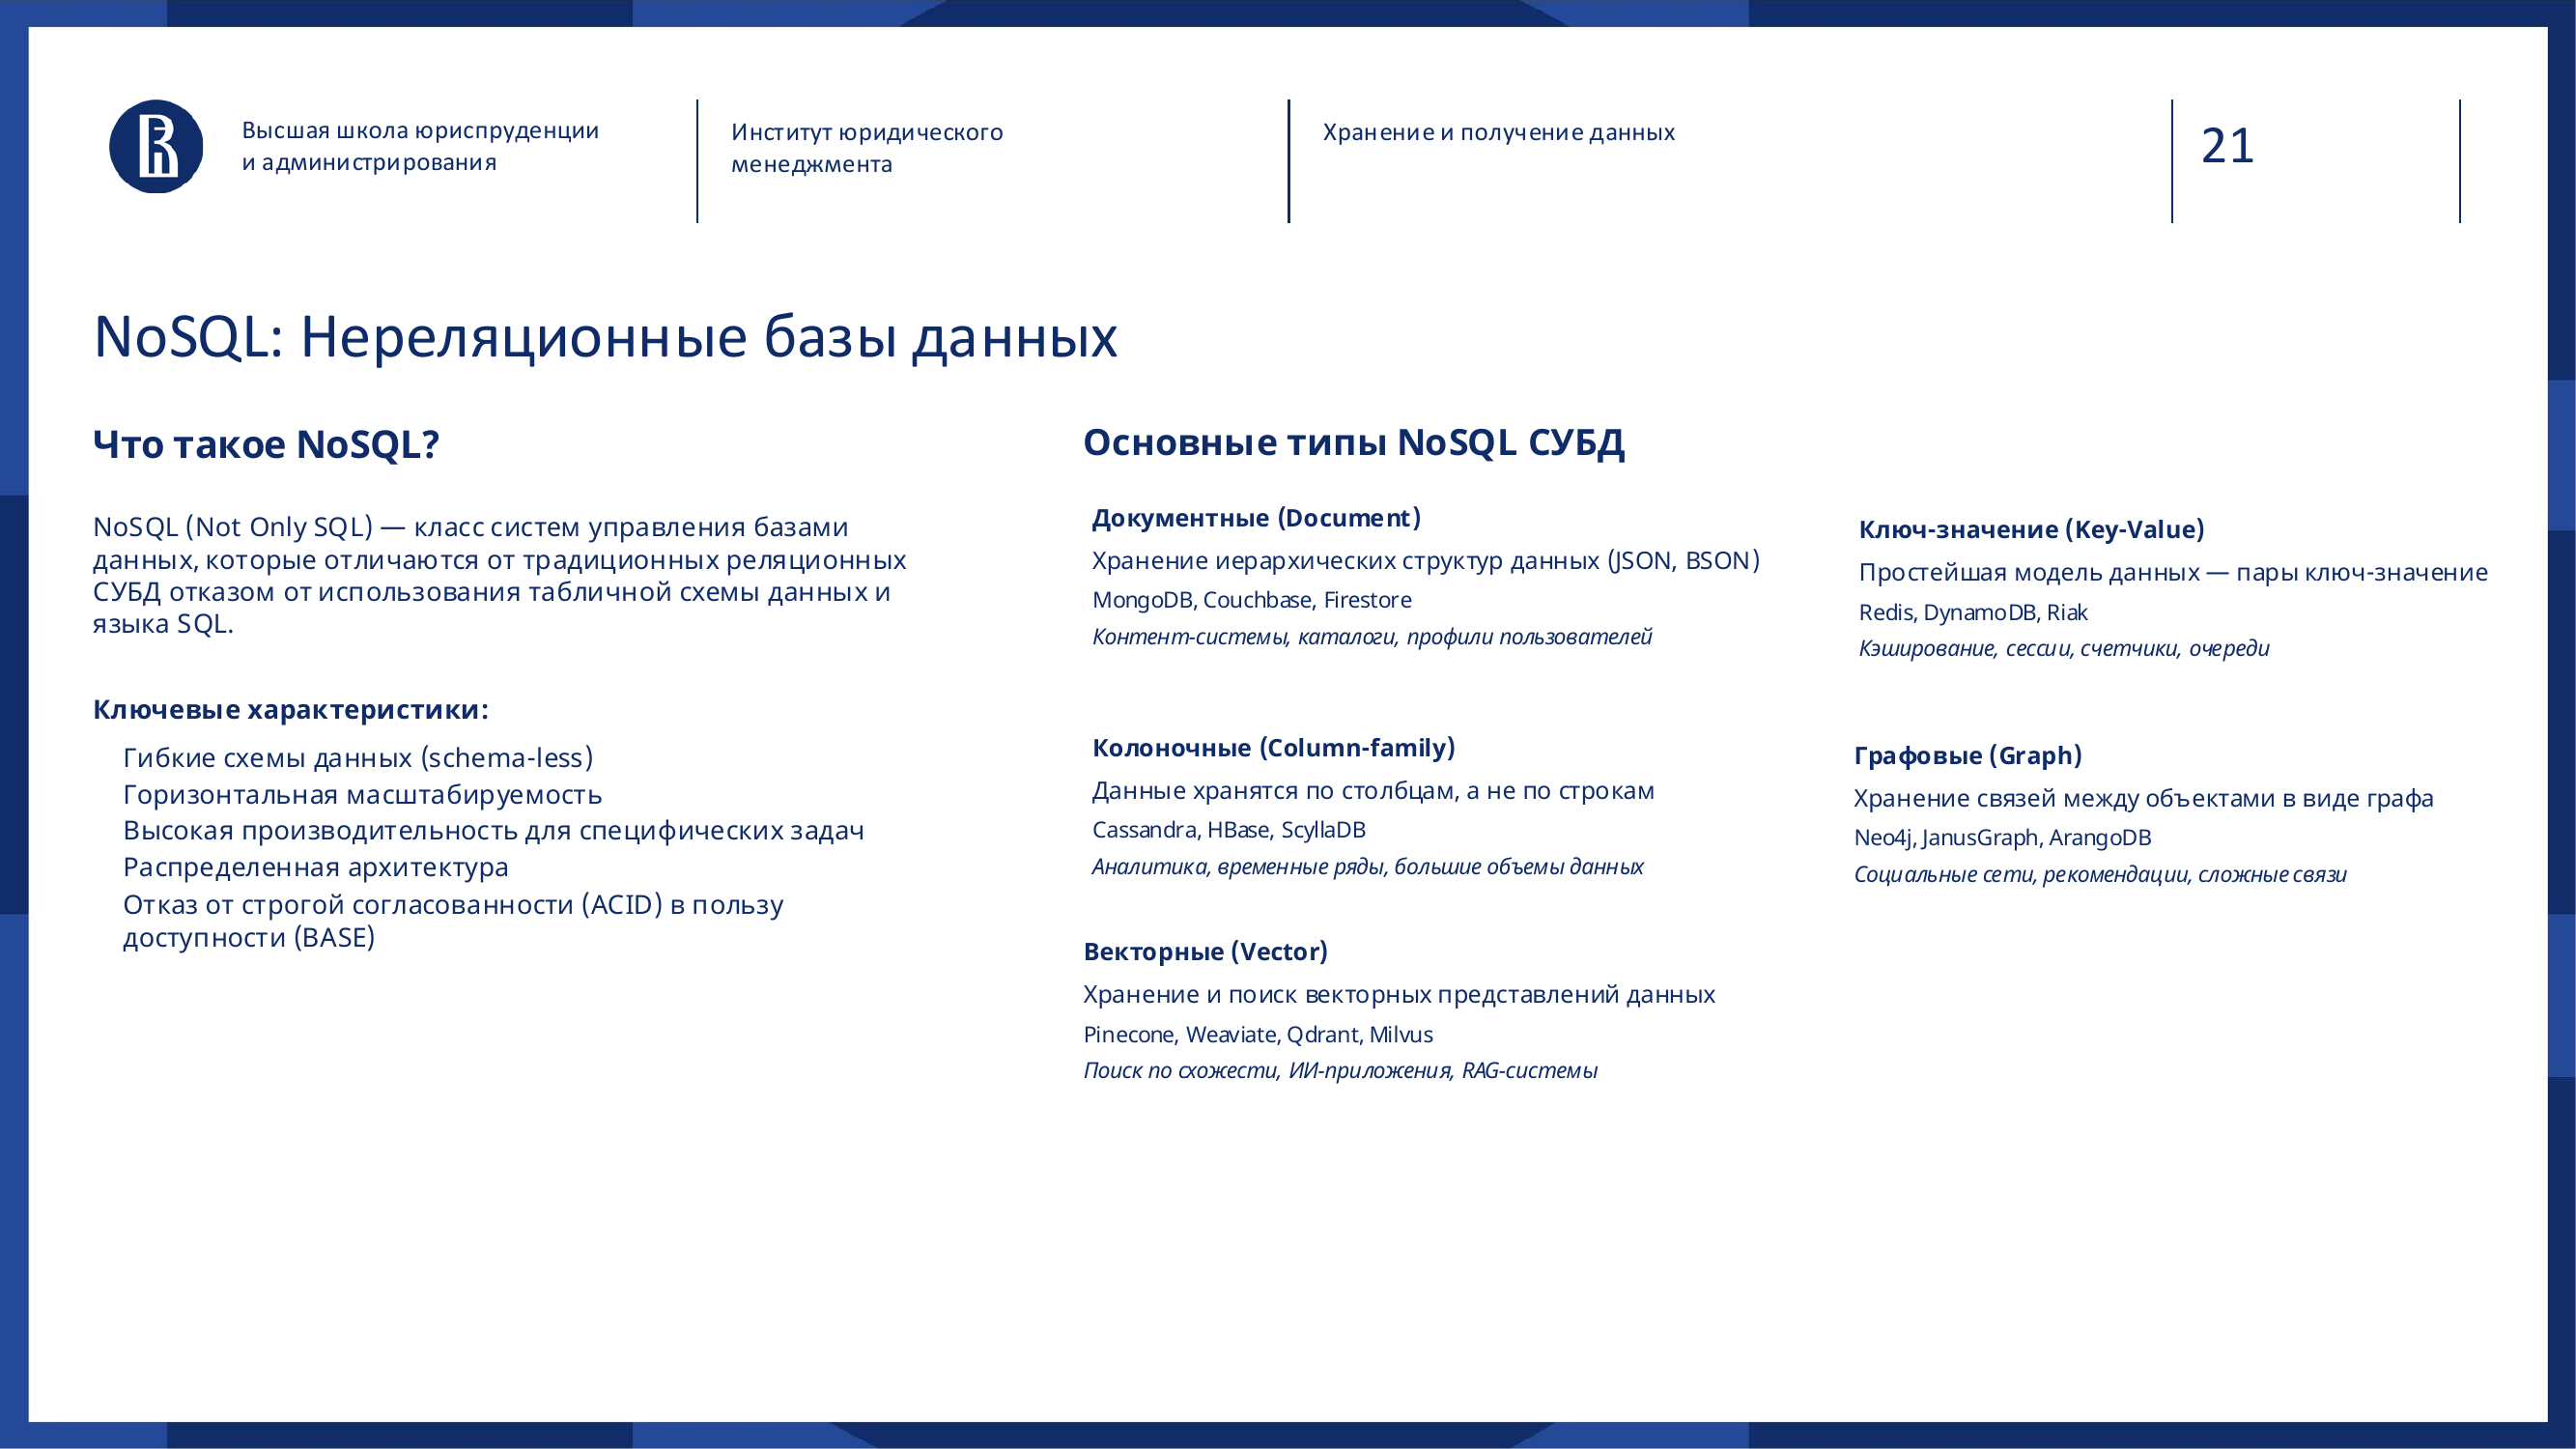
A DBMS is a database management system. The key point here is this: different database types did not appear because of fashion, but because data and tasks became different.
### Relational DBMS
This is the classic category: PostgreSQL, MySQL, Oracle, Microsoft SQL Server.
Data is stored in tables. There are rows, columns, relationships, constraints, transactions and SQL.
A relational database is like a well-organized archive:
- every document has its place;
- everything is described in advance;
- relationships are clear;
- errors are controlled;
- access to data is predictable.
Relational DBMS are strong when:
- the data structure is known in advance;
- integrity matters;
- transactions are needed;
- there are related entities: customers, orders, payments, contracts.
For finance, accounting, ERP, CRM and transactional systems, SQL remains a basic and very strong choice.
### Document DBMS 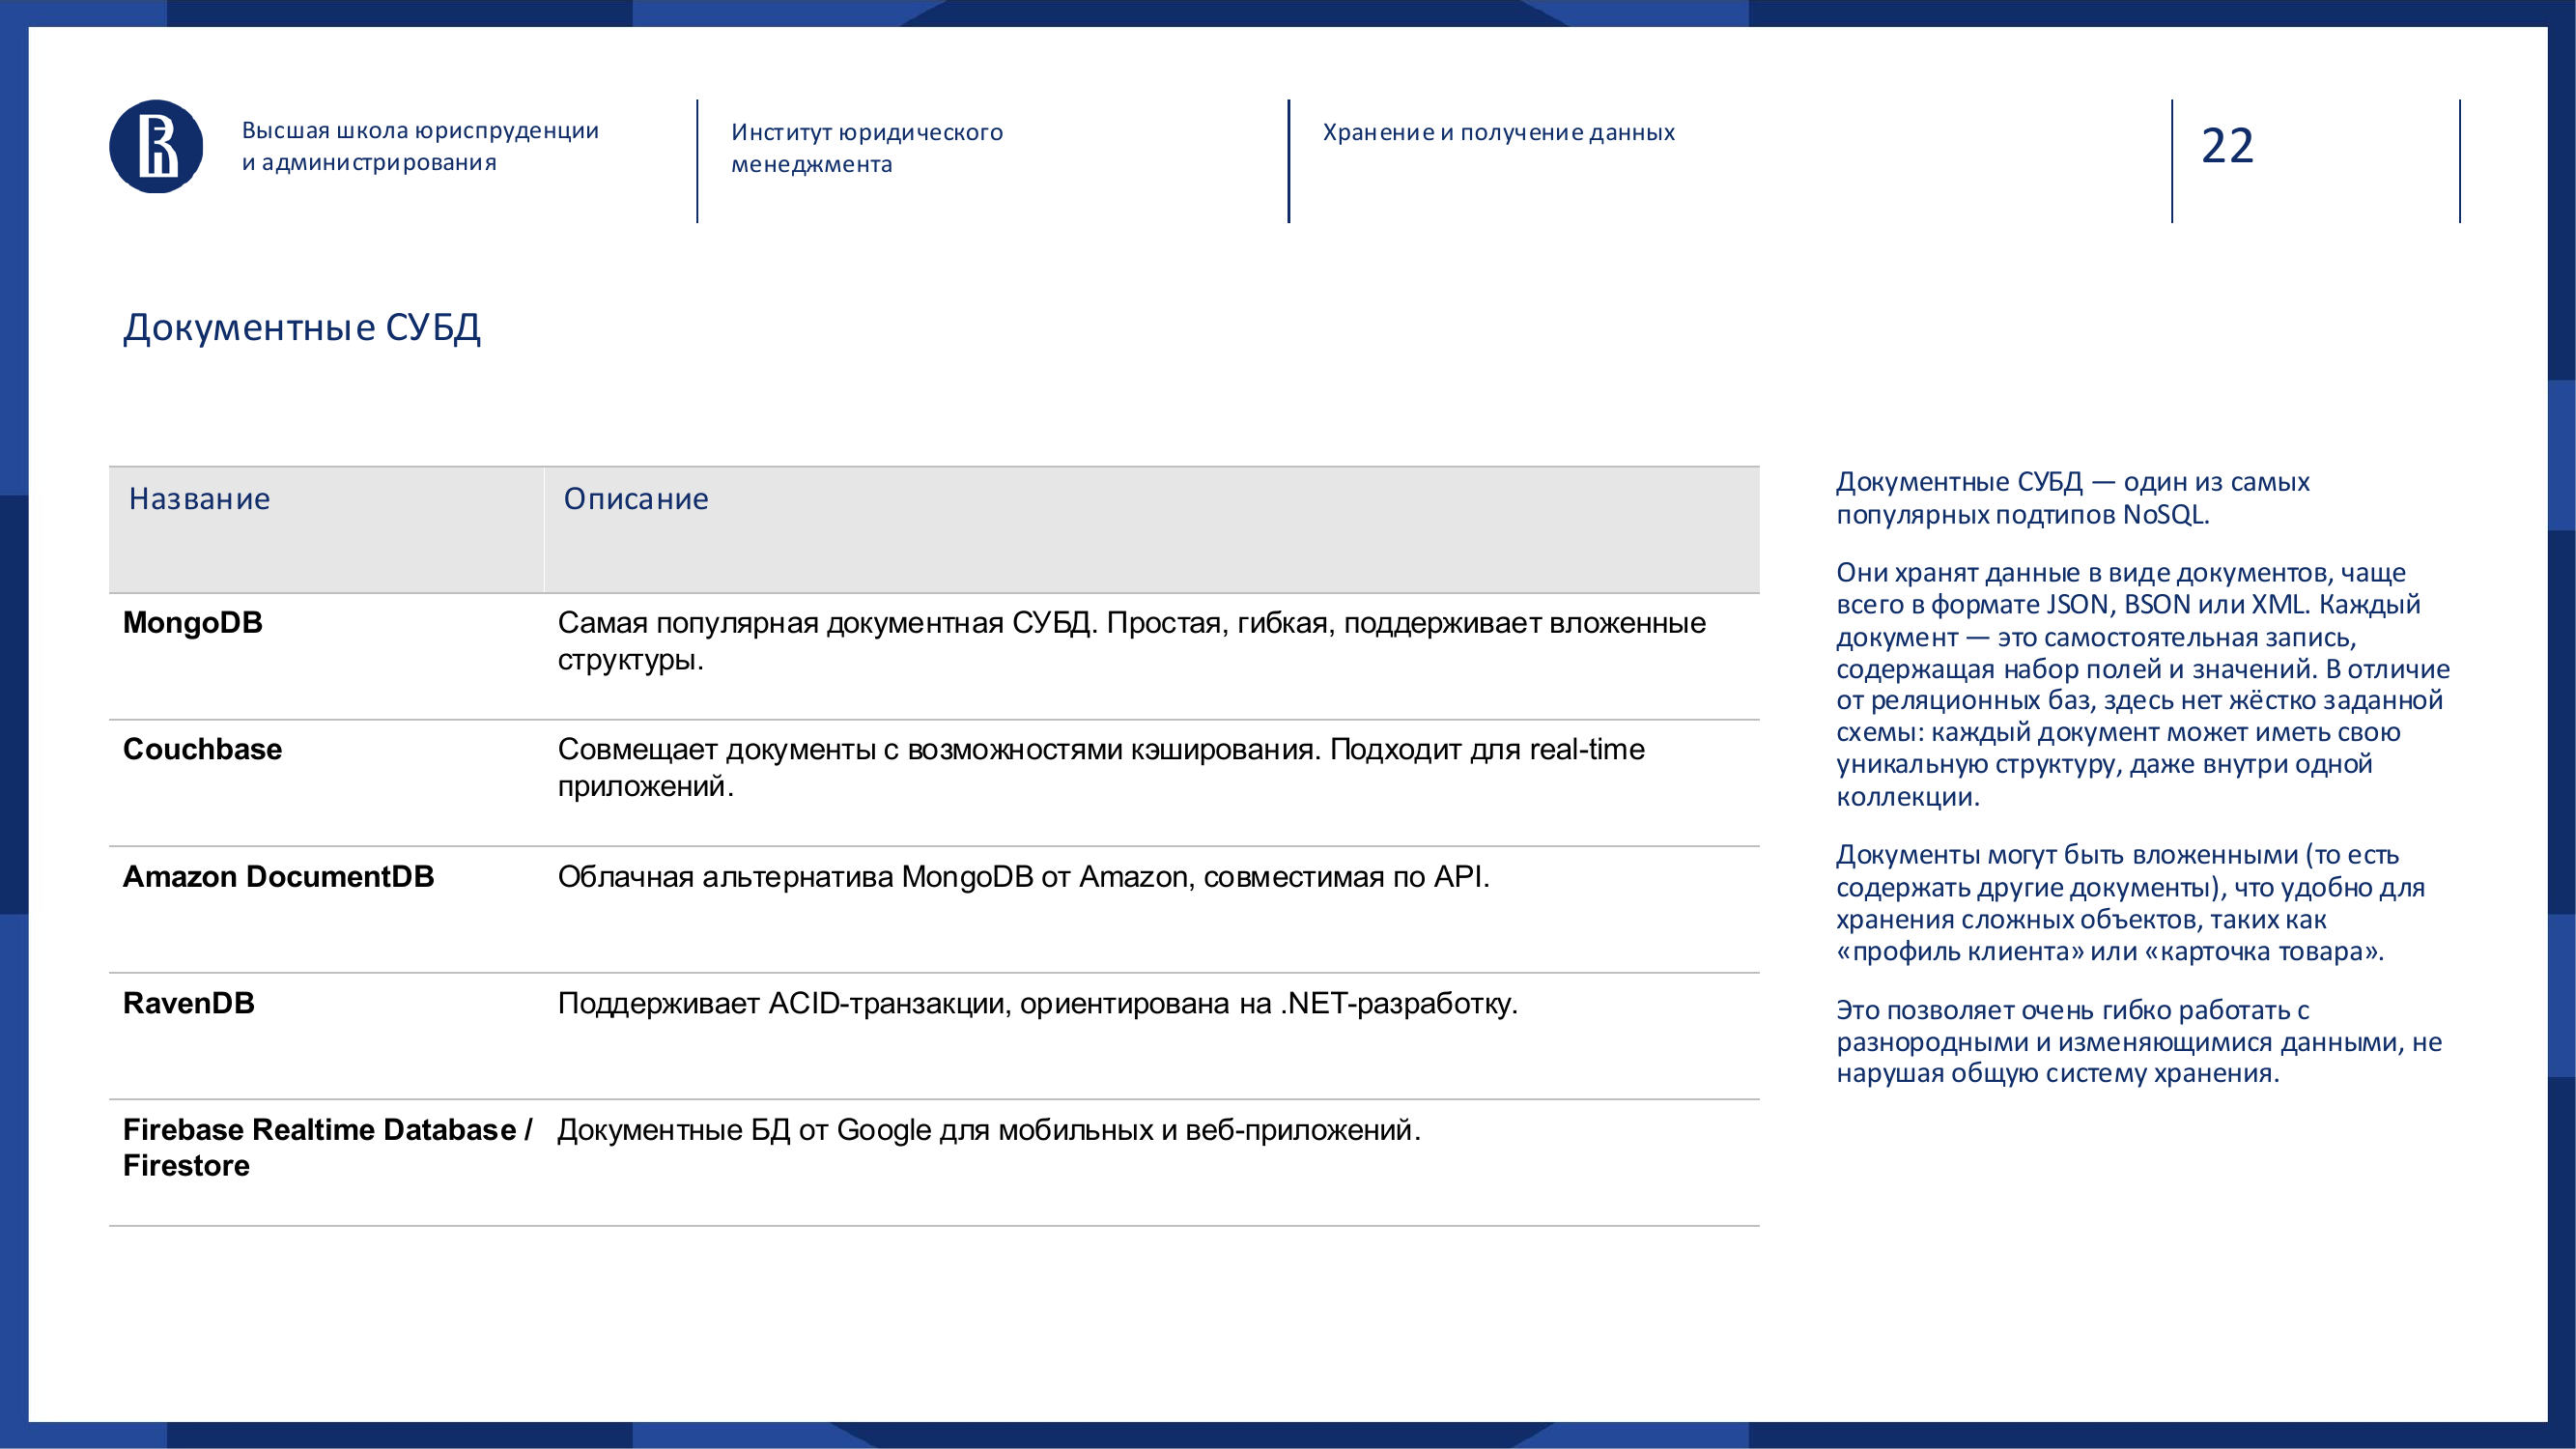
Document databases store data as documents, most often JSON or BSON.
Examples: MongoDB, Couchbase, Firestore.
They are convenient when an object's structure can change. For example, a customer card, user profile, settings or product catalog.
Analogy: a folder with questionnaires. One questionnaire has five fields, another has ten, a third has nested interaction history. You do not need to force everyone to be identical in advance.
Document databases provide flexibility, but they are less suitable for strict financial reporting where a rigid schema and control are needed.
### Column-oriented DBMS 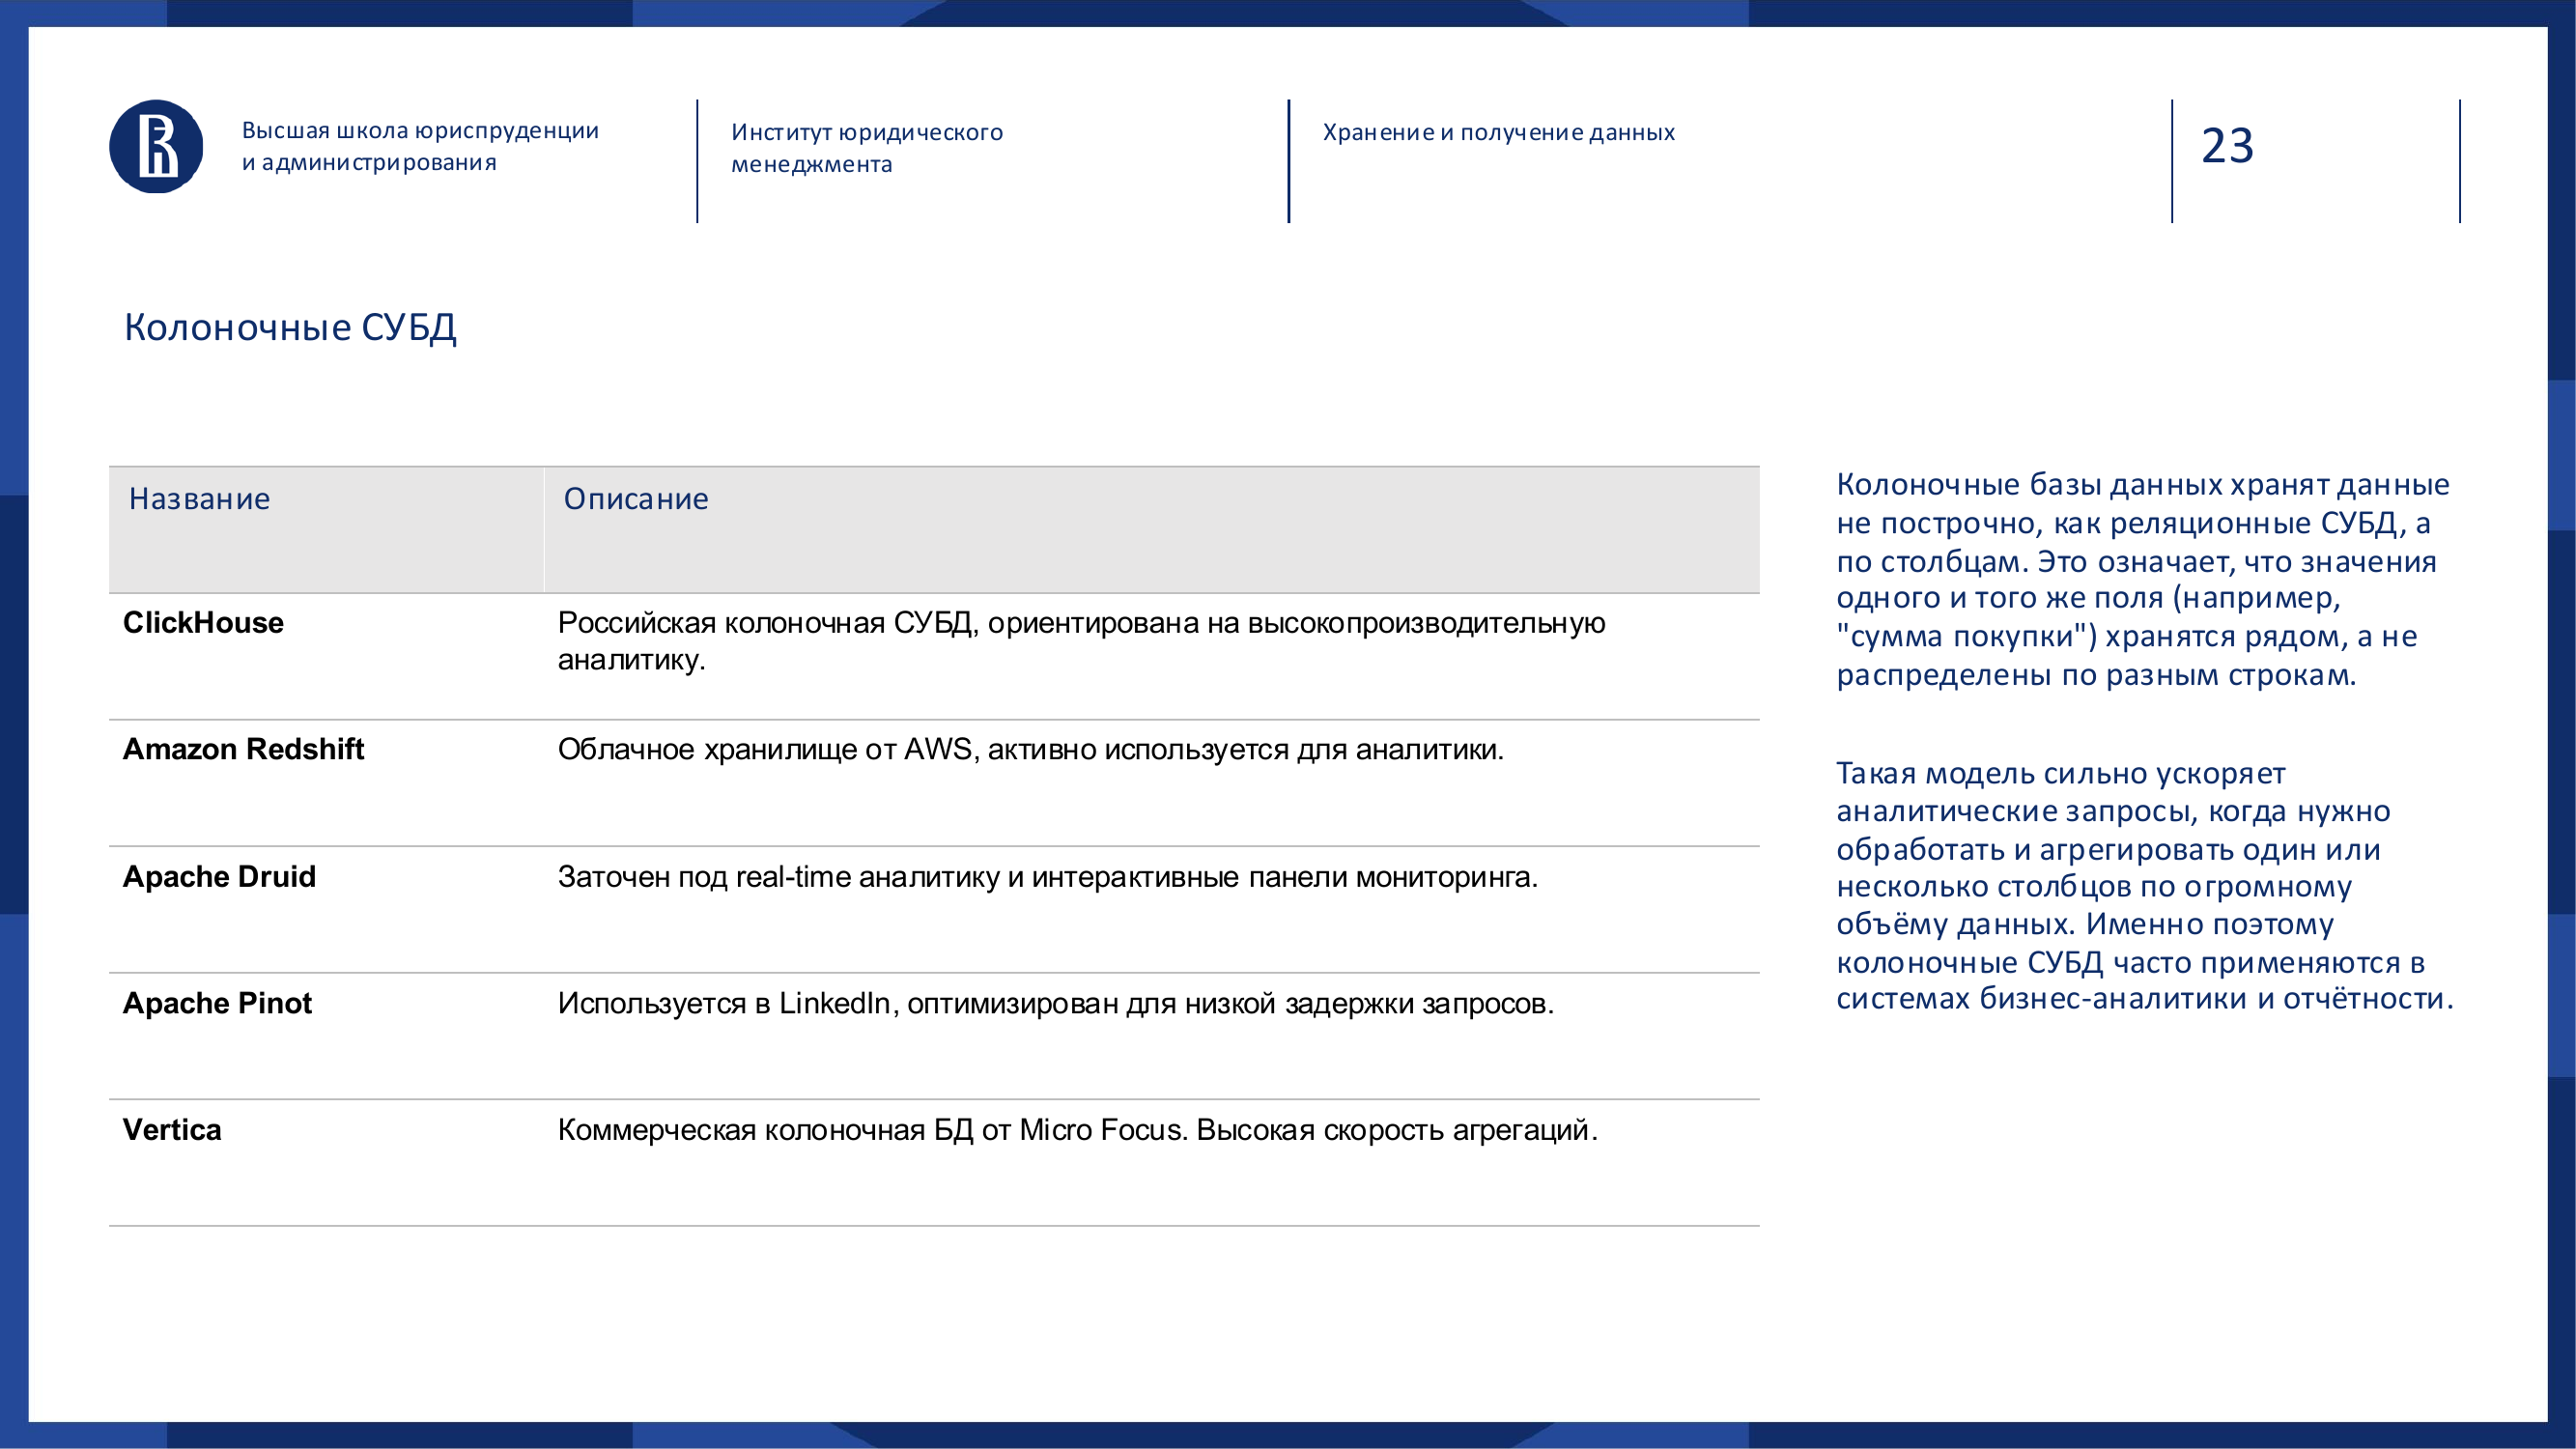
Column-oriented databases store data by columns, not by rows.
Examples: ClickHouse, Amazon Redshift, Apache Druid, Apache Pinot, Vertica.
This is especially useful for analytics. If you need to calculate total sales over a billion rows, the system does not have to read every whole row. It can read only the needed column, for example amount.
Analogy: in a huge Excel table, you work not with the whole sheet, but only with the “Amount” column.
Column-oriented databases are good for BI, reports, event analytics, logs, monitoring and product analytics.
But they are not designed for classic transactions like “create an order and reliably charge payment”.
### Key-value stores 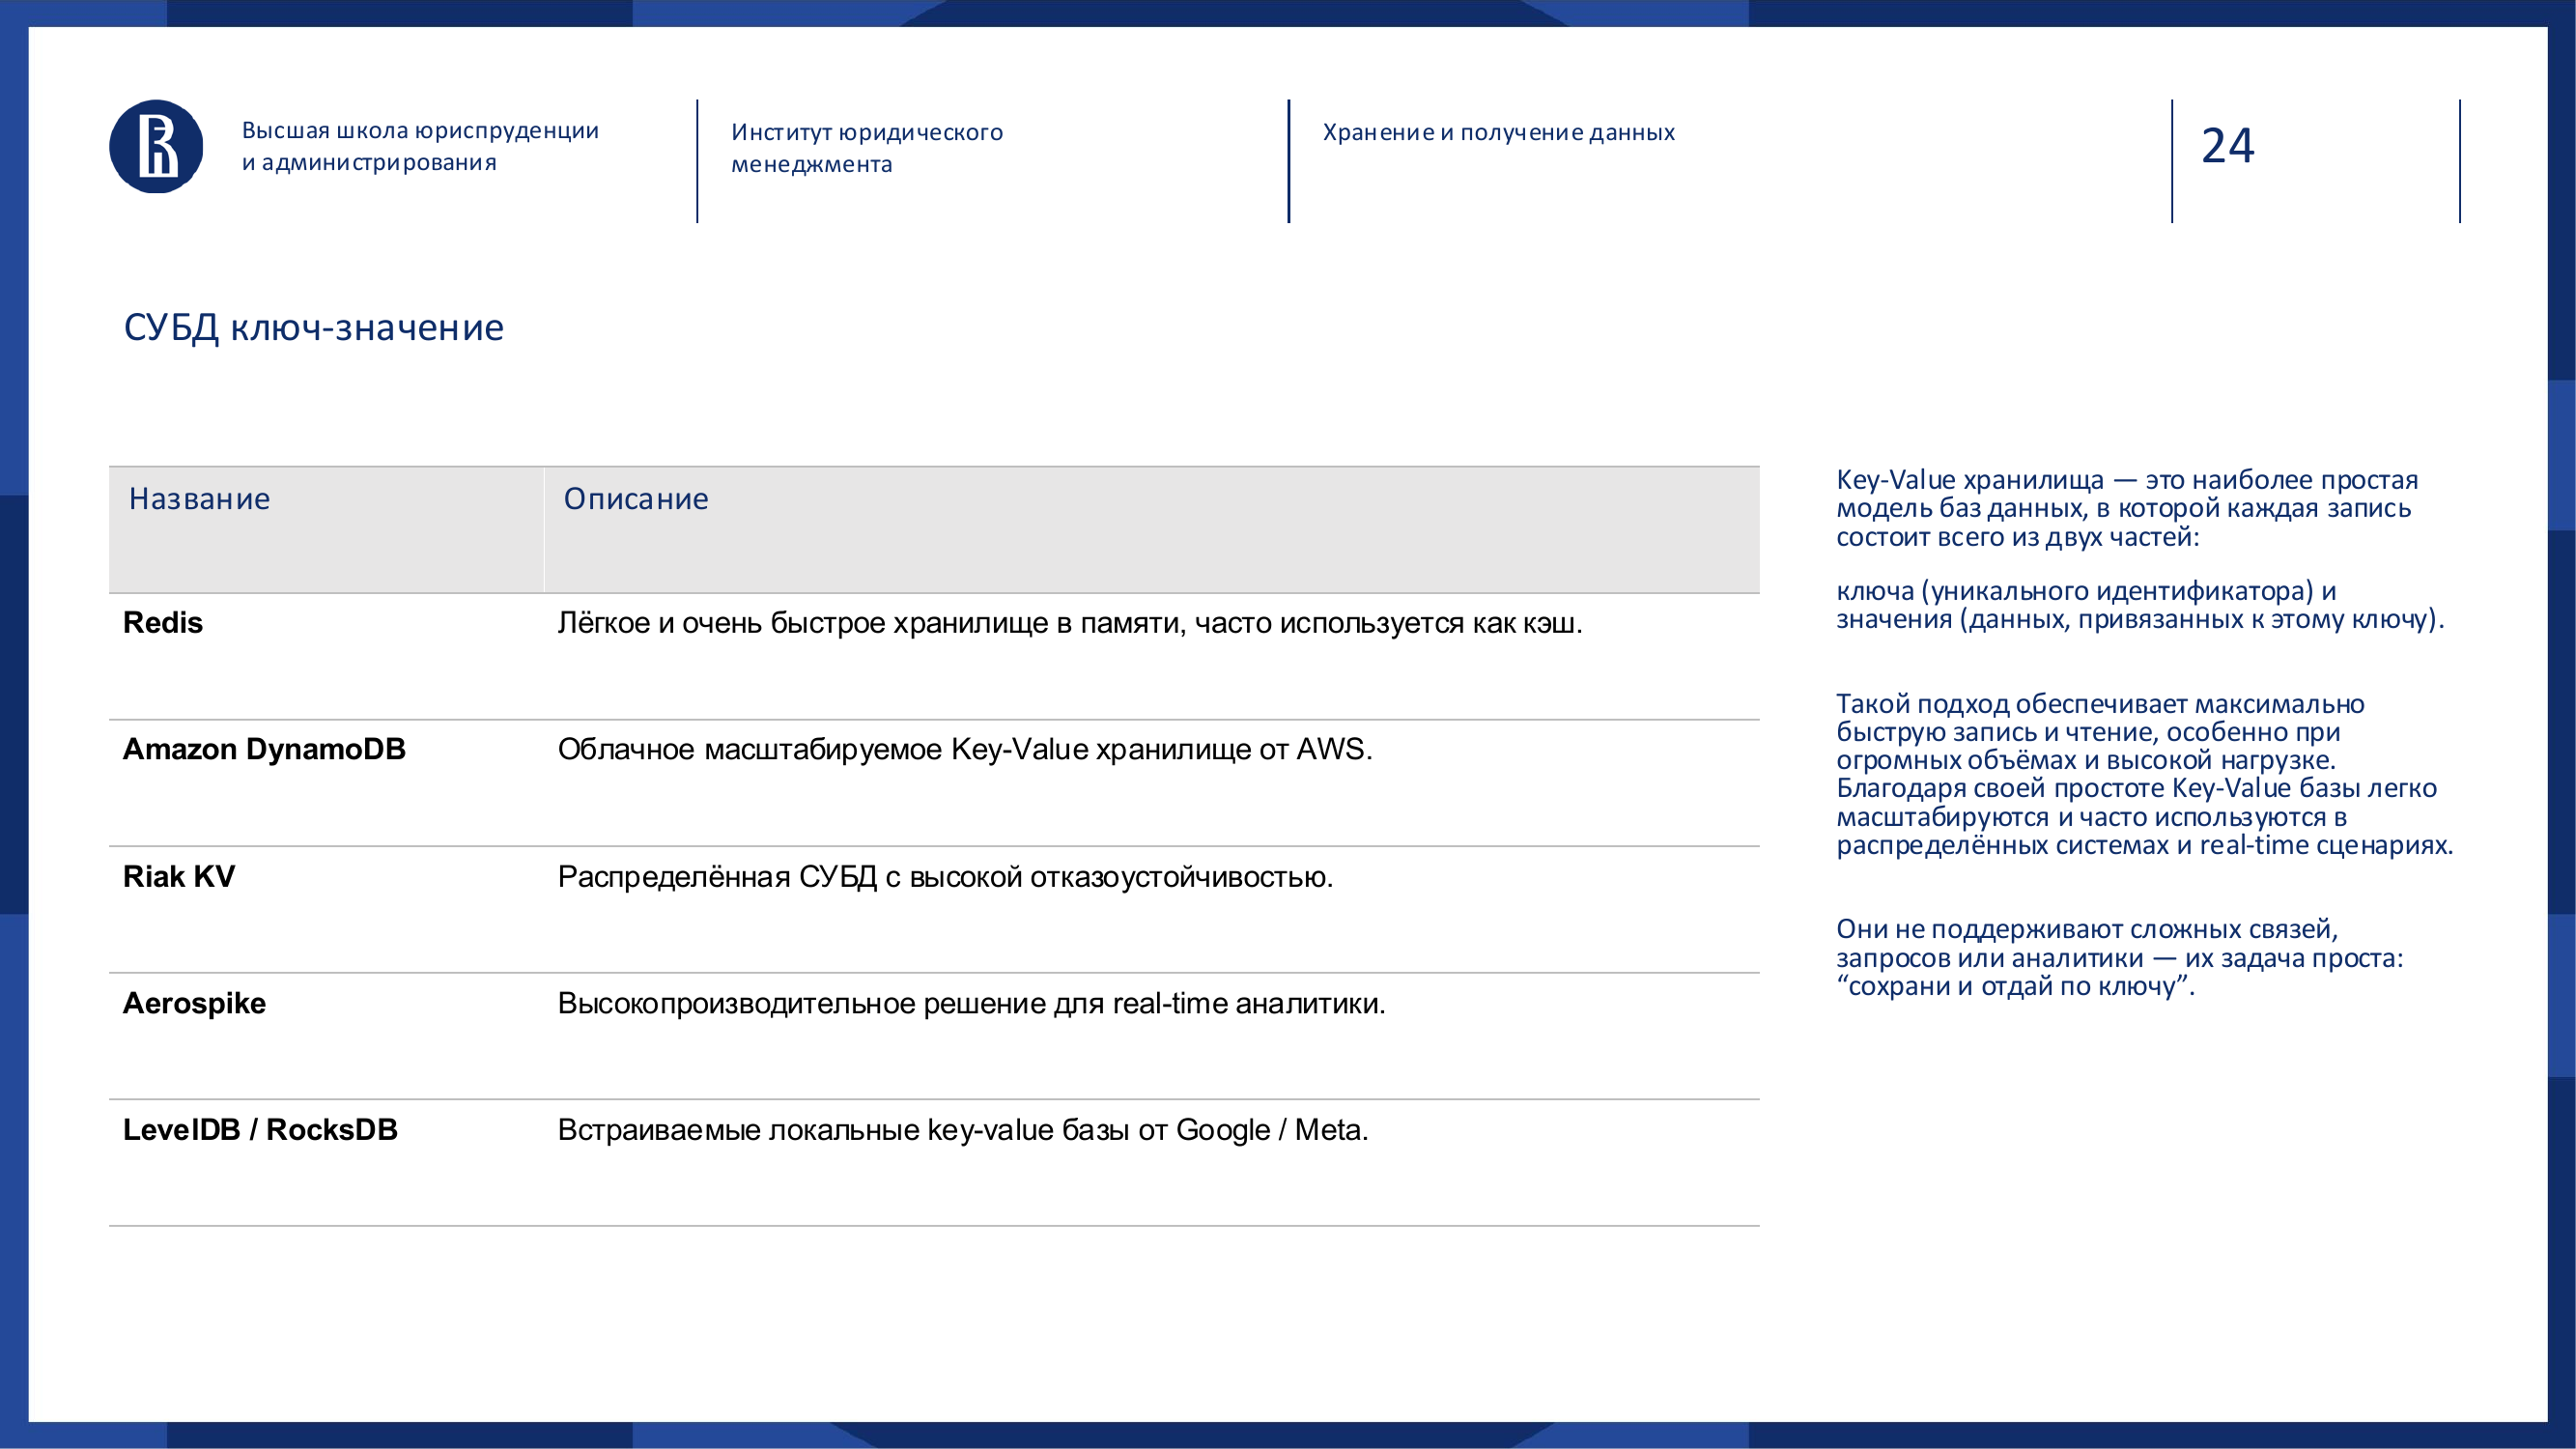
Key-value is the simplest model: there is a key and a value.
Examples: Redis, DynamoDB, Riak, RocksDB.
Analogy: a storage locker. If you know the locker number, you quickly get its contents.
Such databases are good for cache, sessions, tokens, counters, temporary data and fast operations.
But if you need complex analytics, relationships, filters and reports, that is not their job.
### Graph DBMS 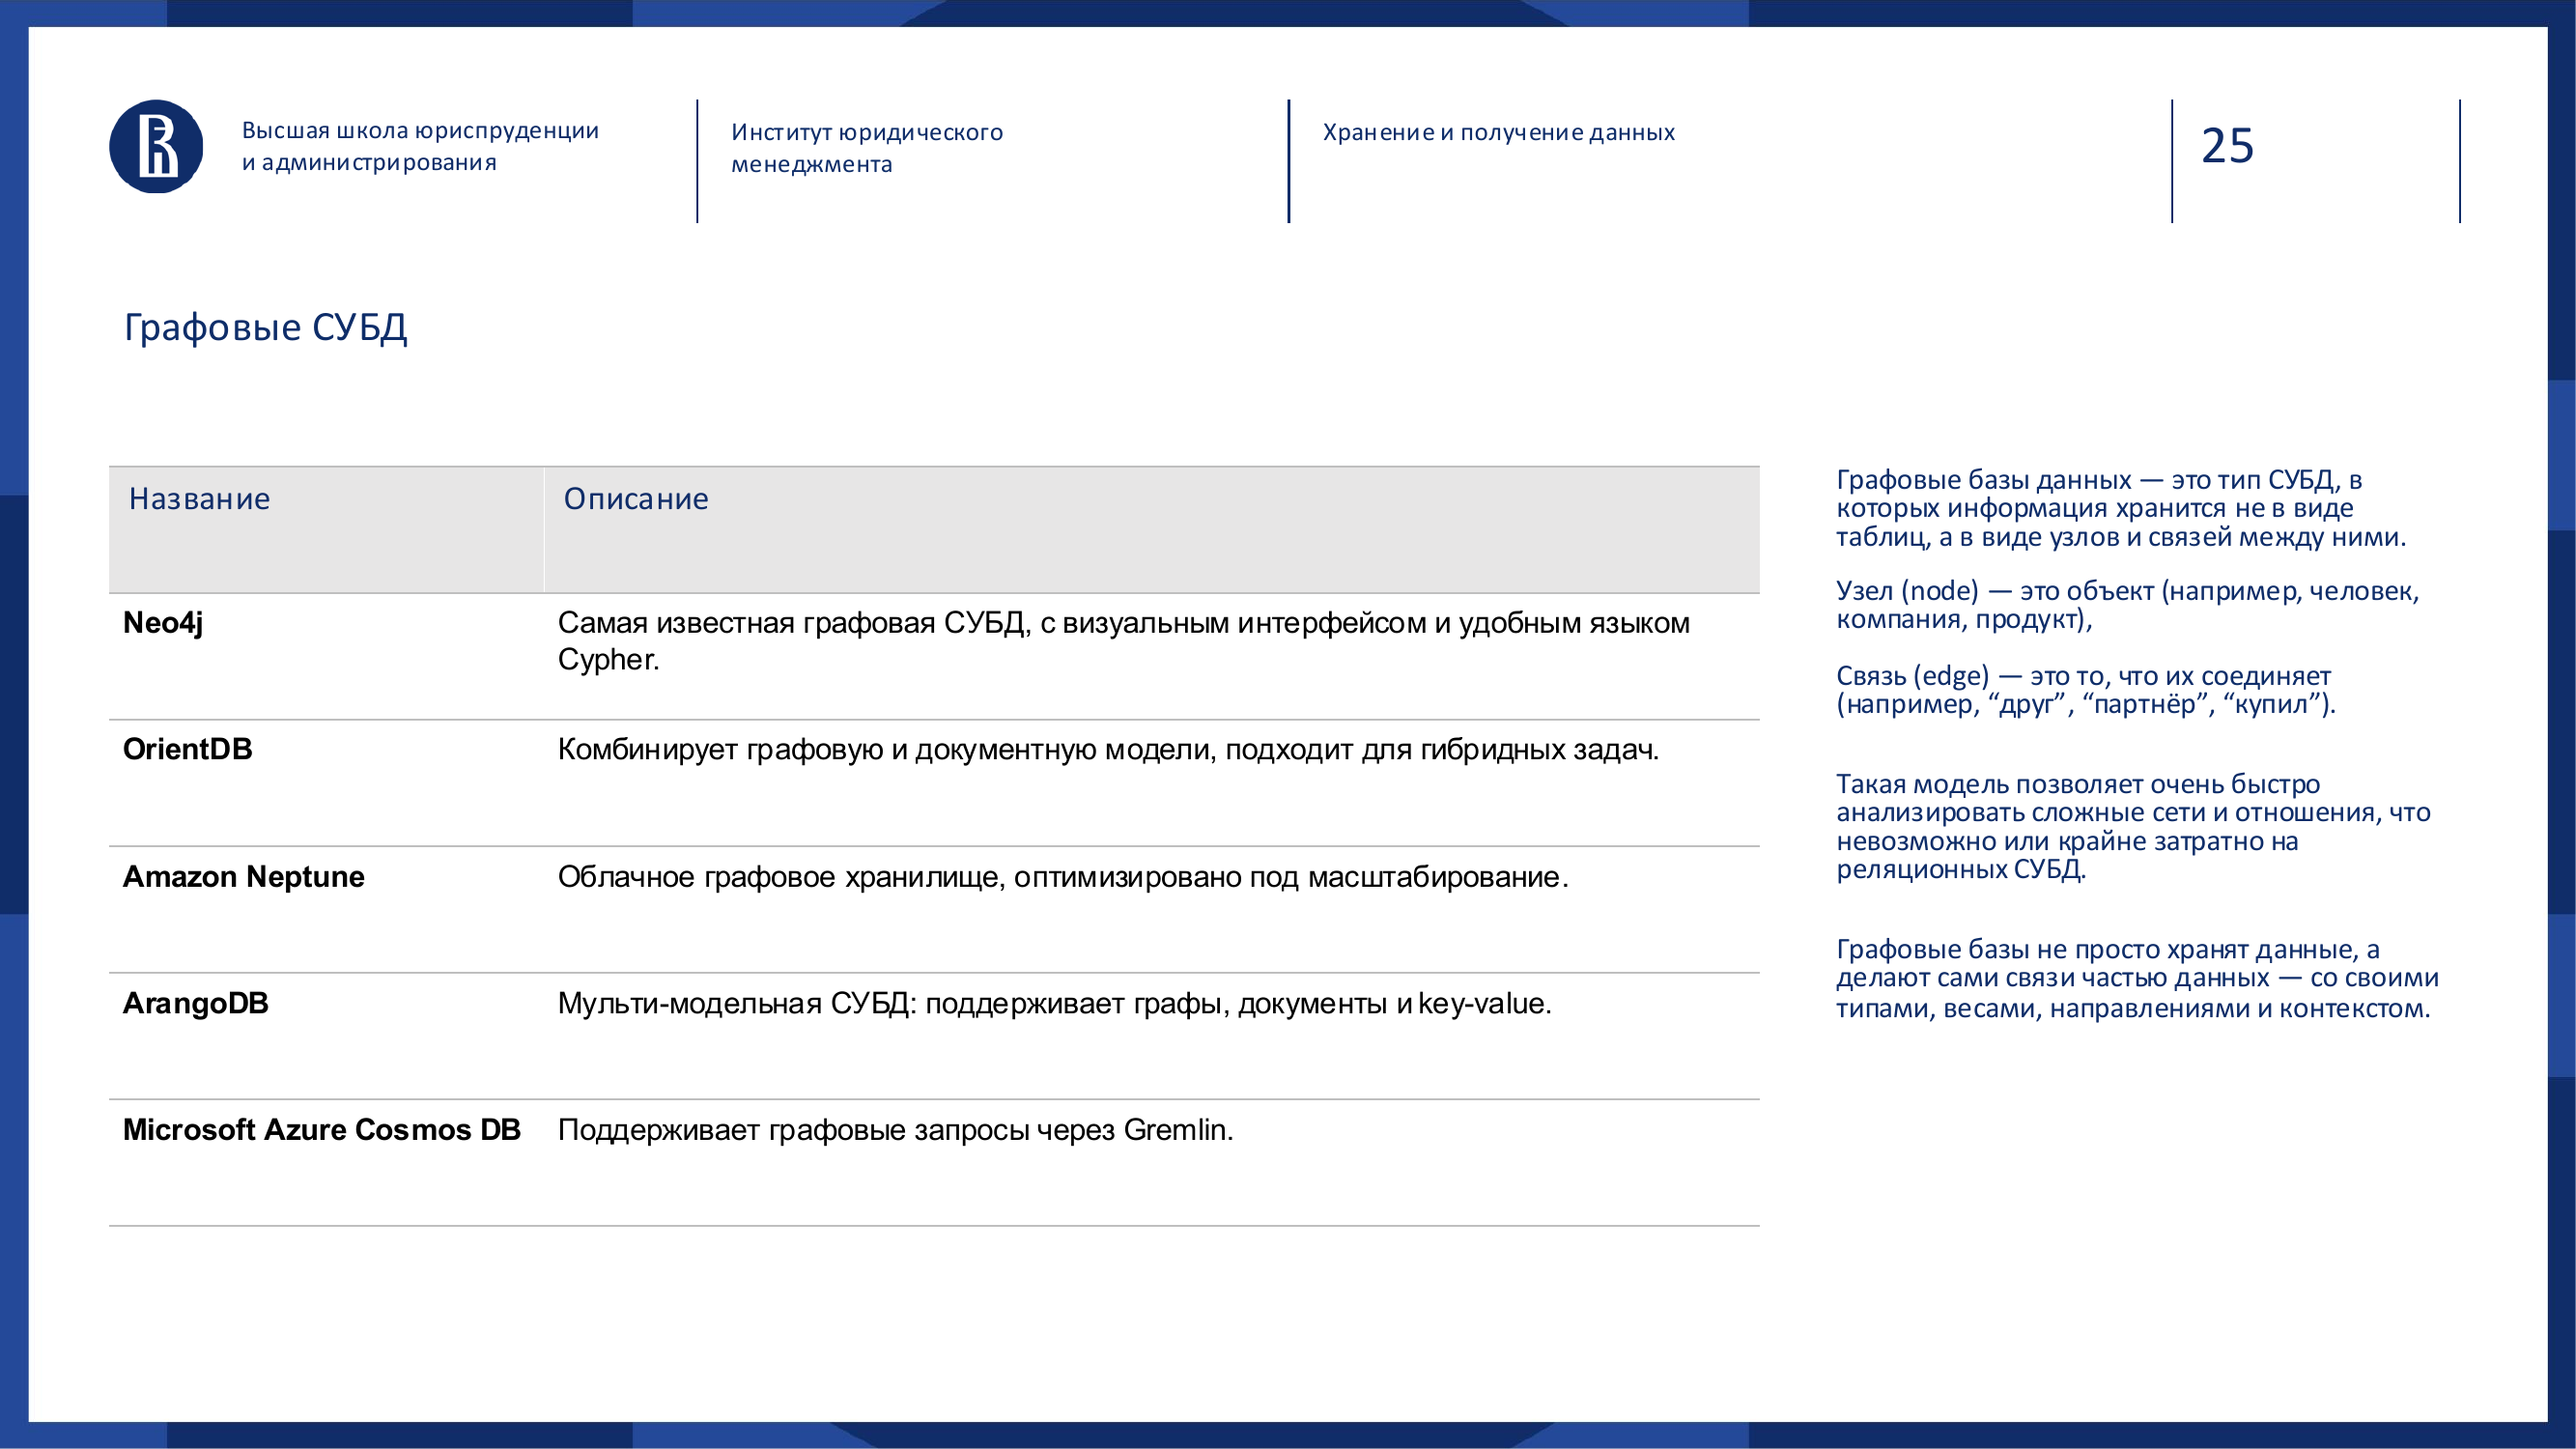
Graph databases store not only objects, but also relationships between them.
Examples: Neo4j, JanusGraph, ArangoDB, Amazon Neptune.
A node is an object: a person, company, product or account. An edge is a relationship: bought, knows, owns, connected, transferred money, follows.
Analogy: a metro map. Stations matter, but the routes between them matter just as much.
Graph databases are strong where relationships matter more than the objects themselves:
- social networks;
- recommendations;
- antifraud;
- ownership chains;
- routes;
- dependencies;
- hierarchies.
Where a relational database starts to suffer from many JOINs, a graph database may be the natural solution.
### Vector DBMS 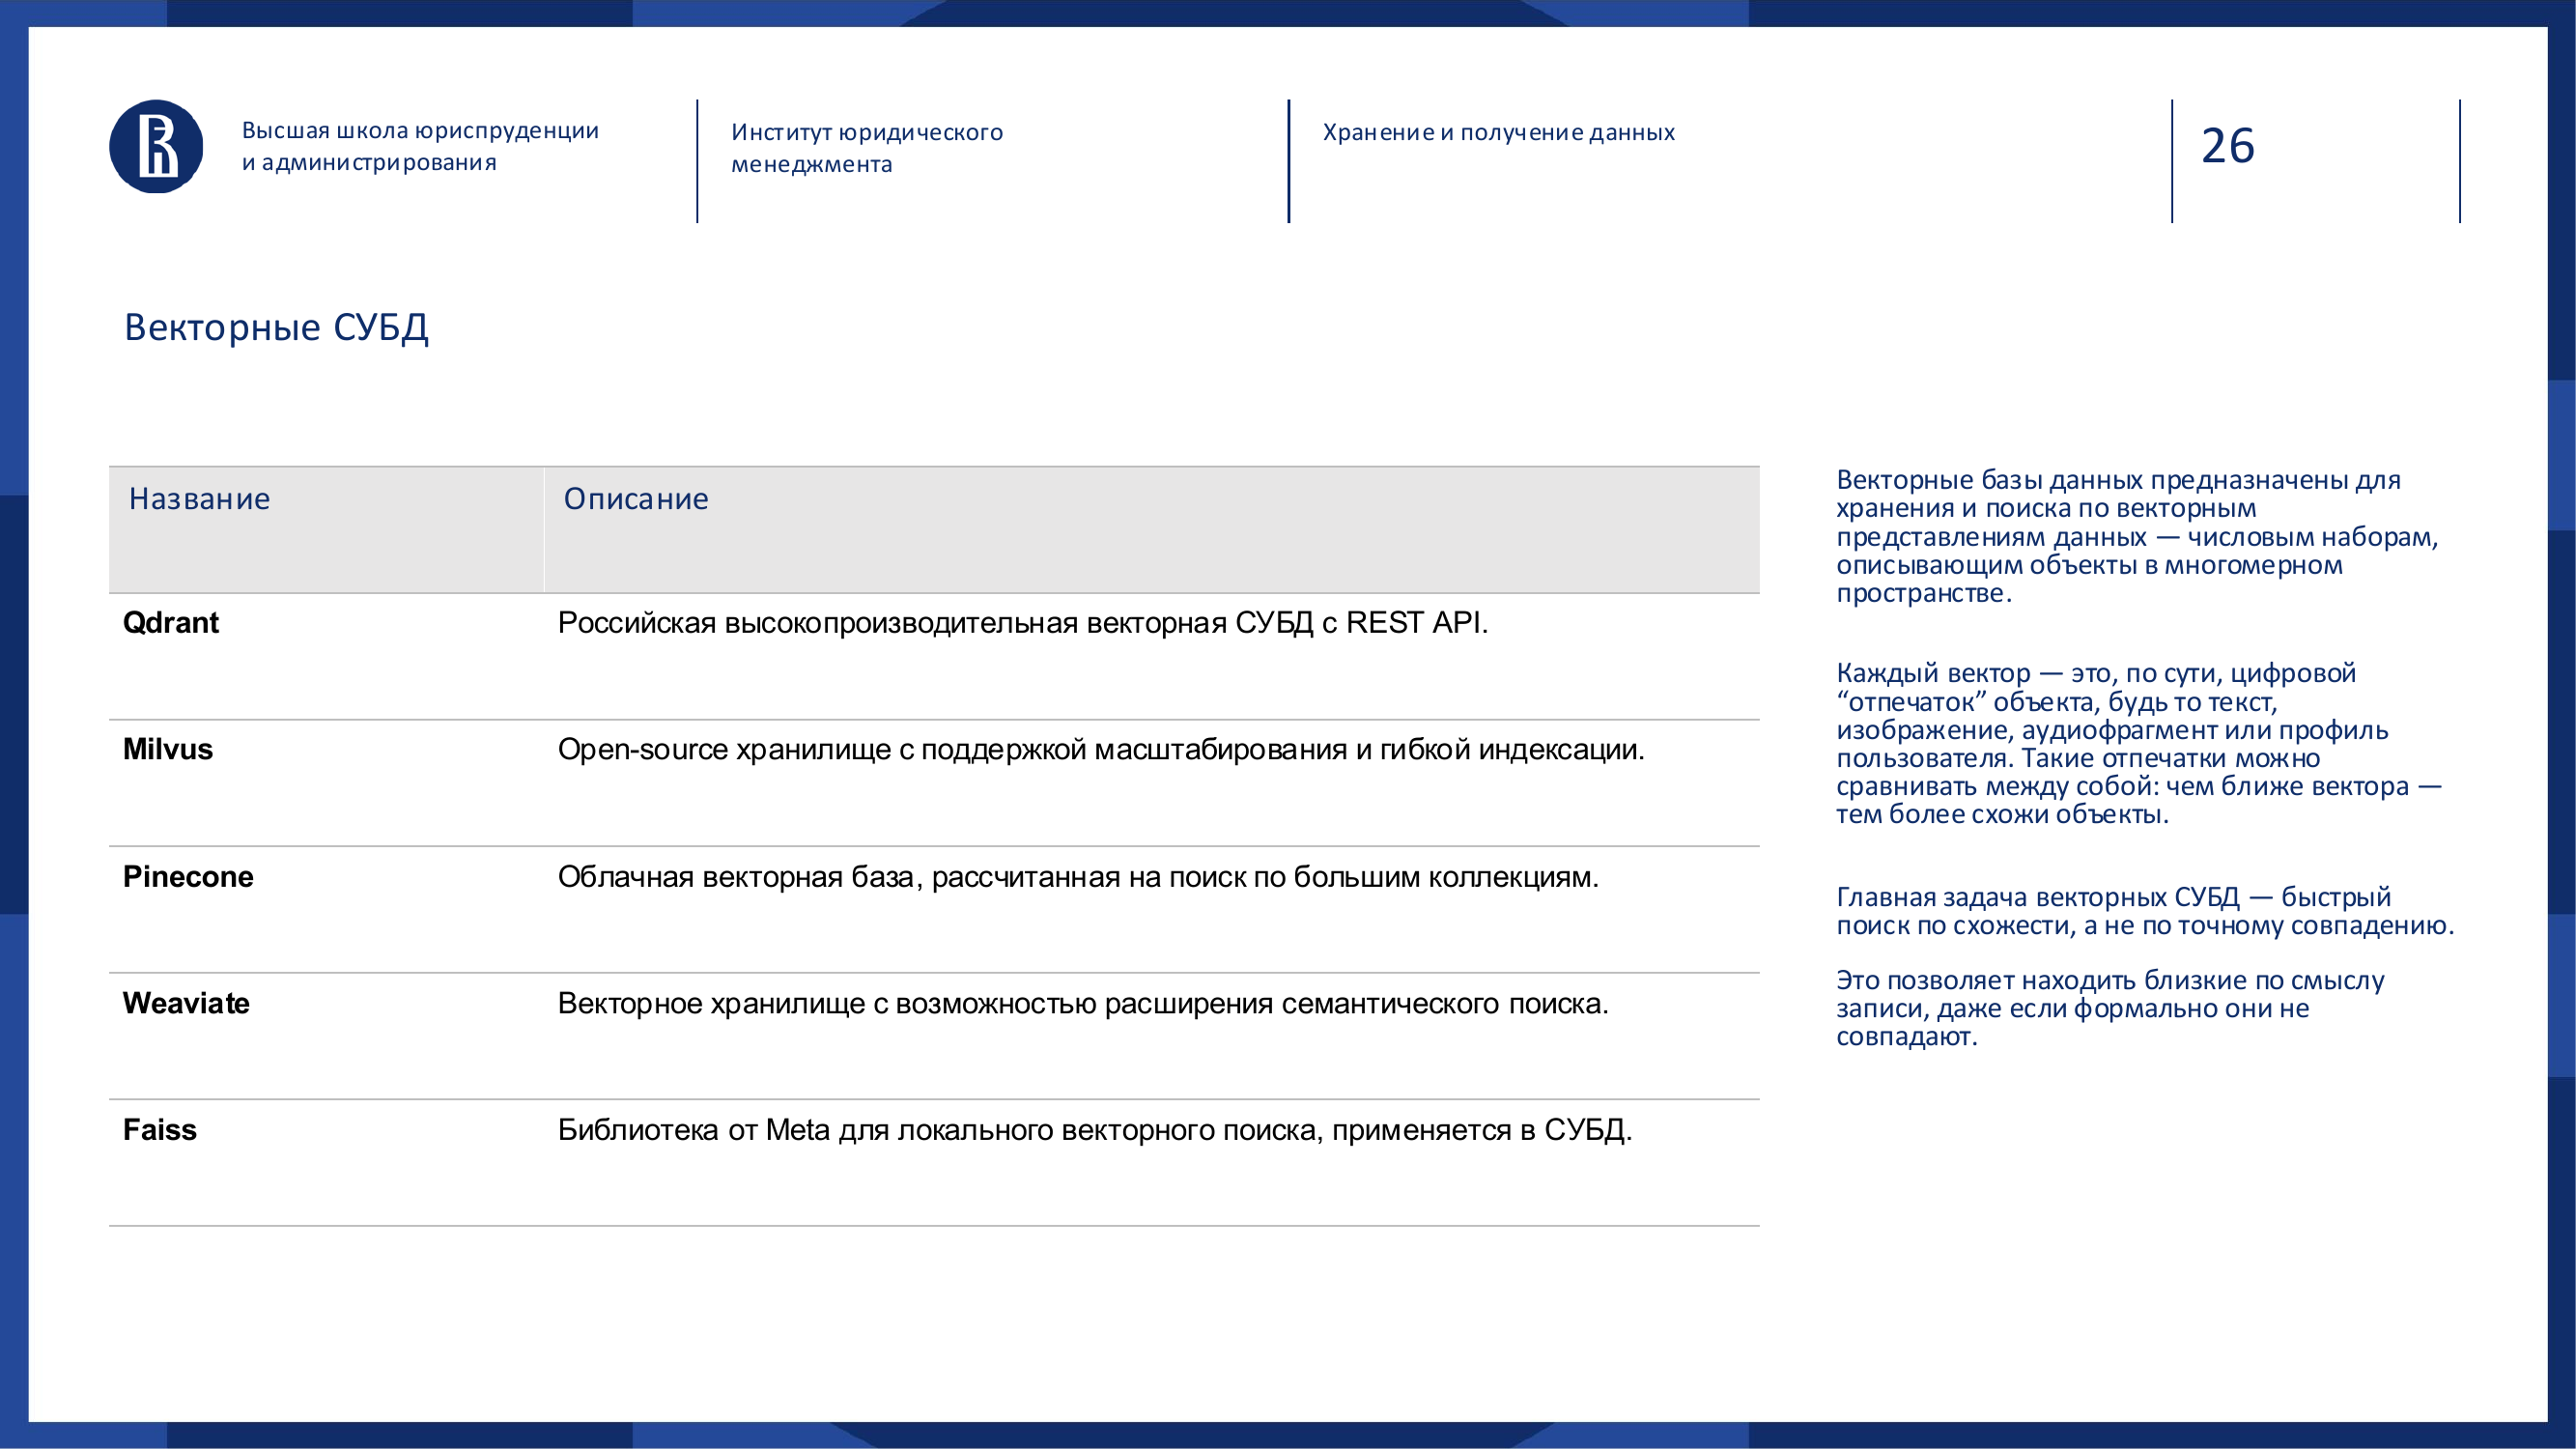
Vector databases store numeric representations of objects: texts, images, audio, profiles and documents.
Examples: Qdrant, Milvus, Pinecone, Weaviate, Faiss.
Their job is to search not for exact matches, but for similarity.
Traditional search looks for words. Vector search looks for meaning.
For example, the query “how to arrange a business trip” can find a document called “business travel policy”, even if that exact phrase is not in the document.
Vector databases became especially important with LLMs and RAG architectures.
### In-memory DBMS 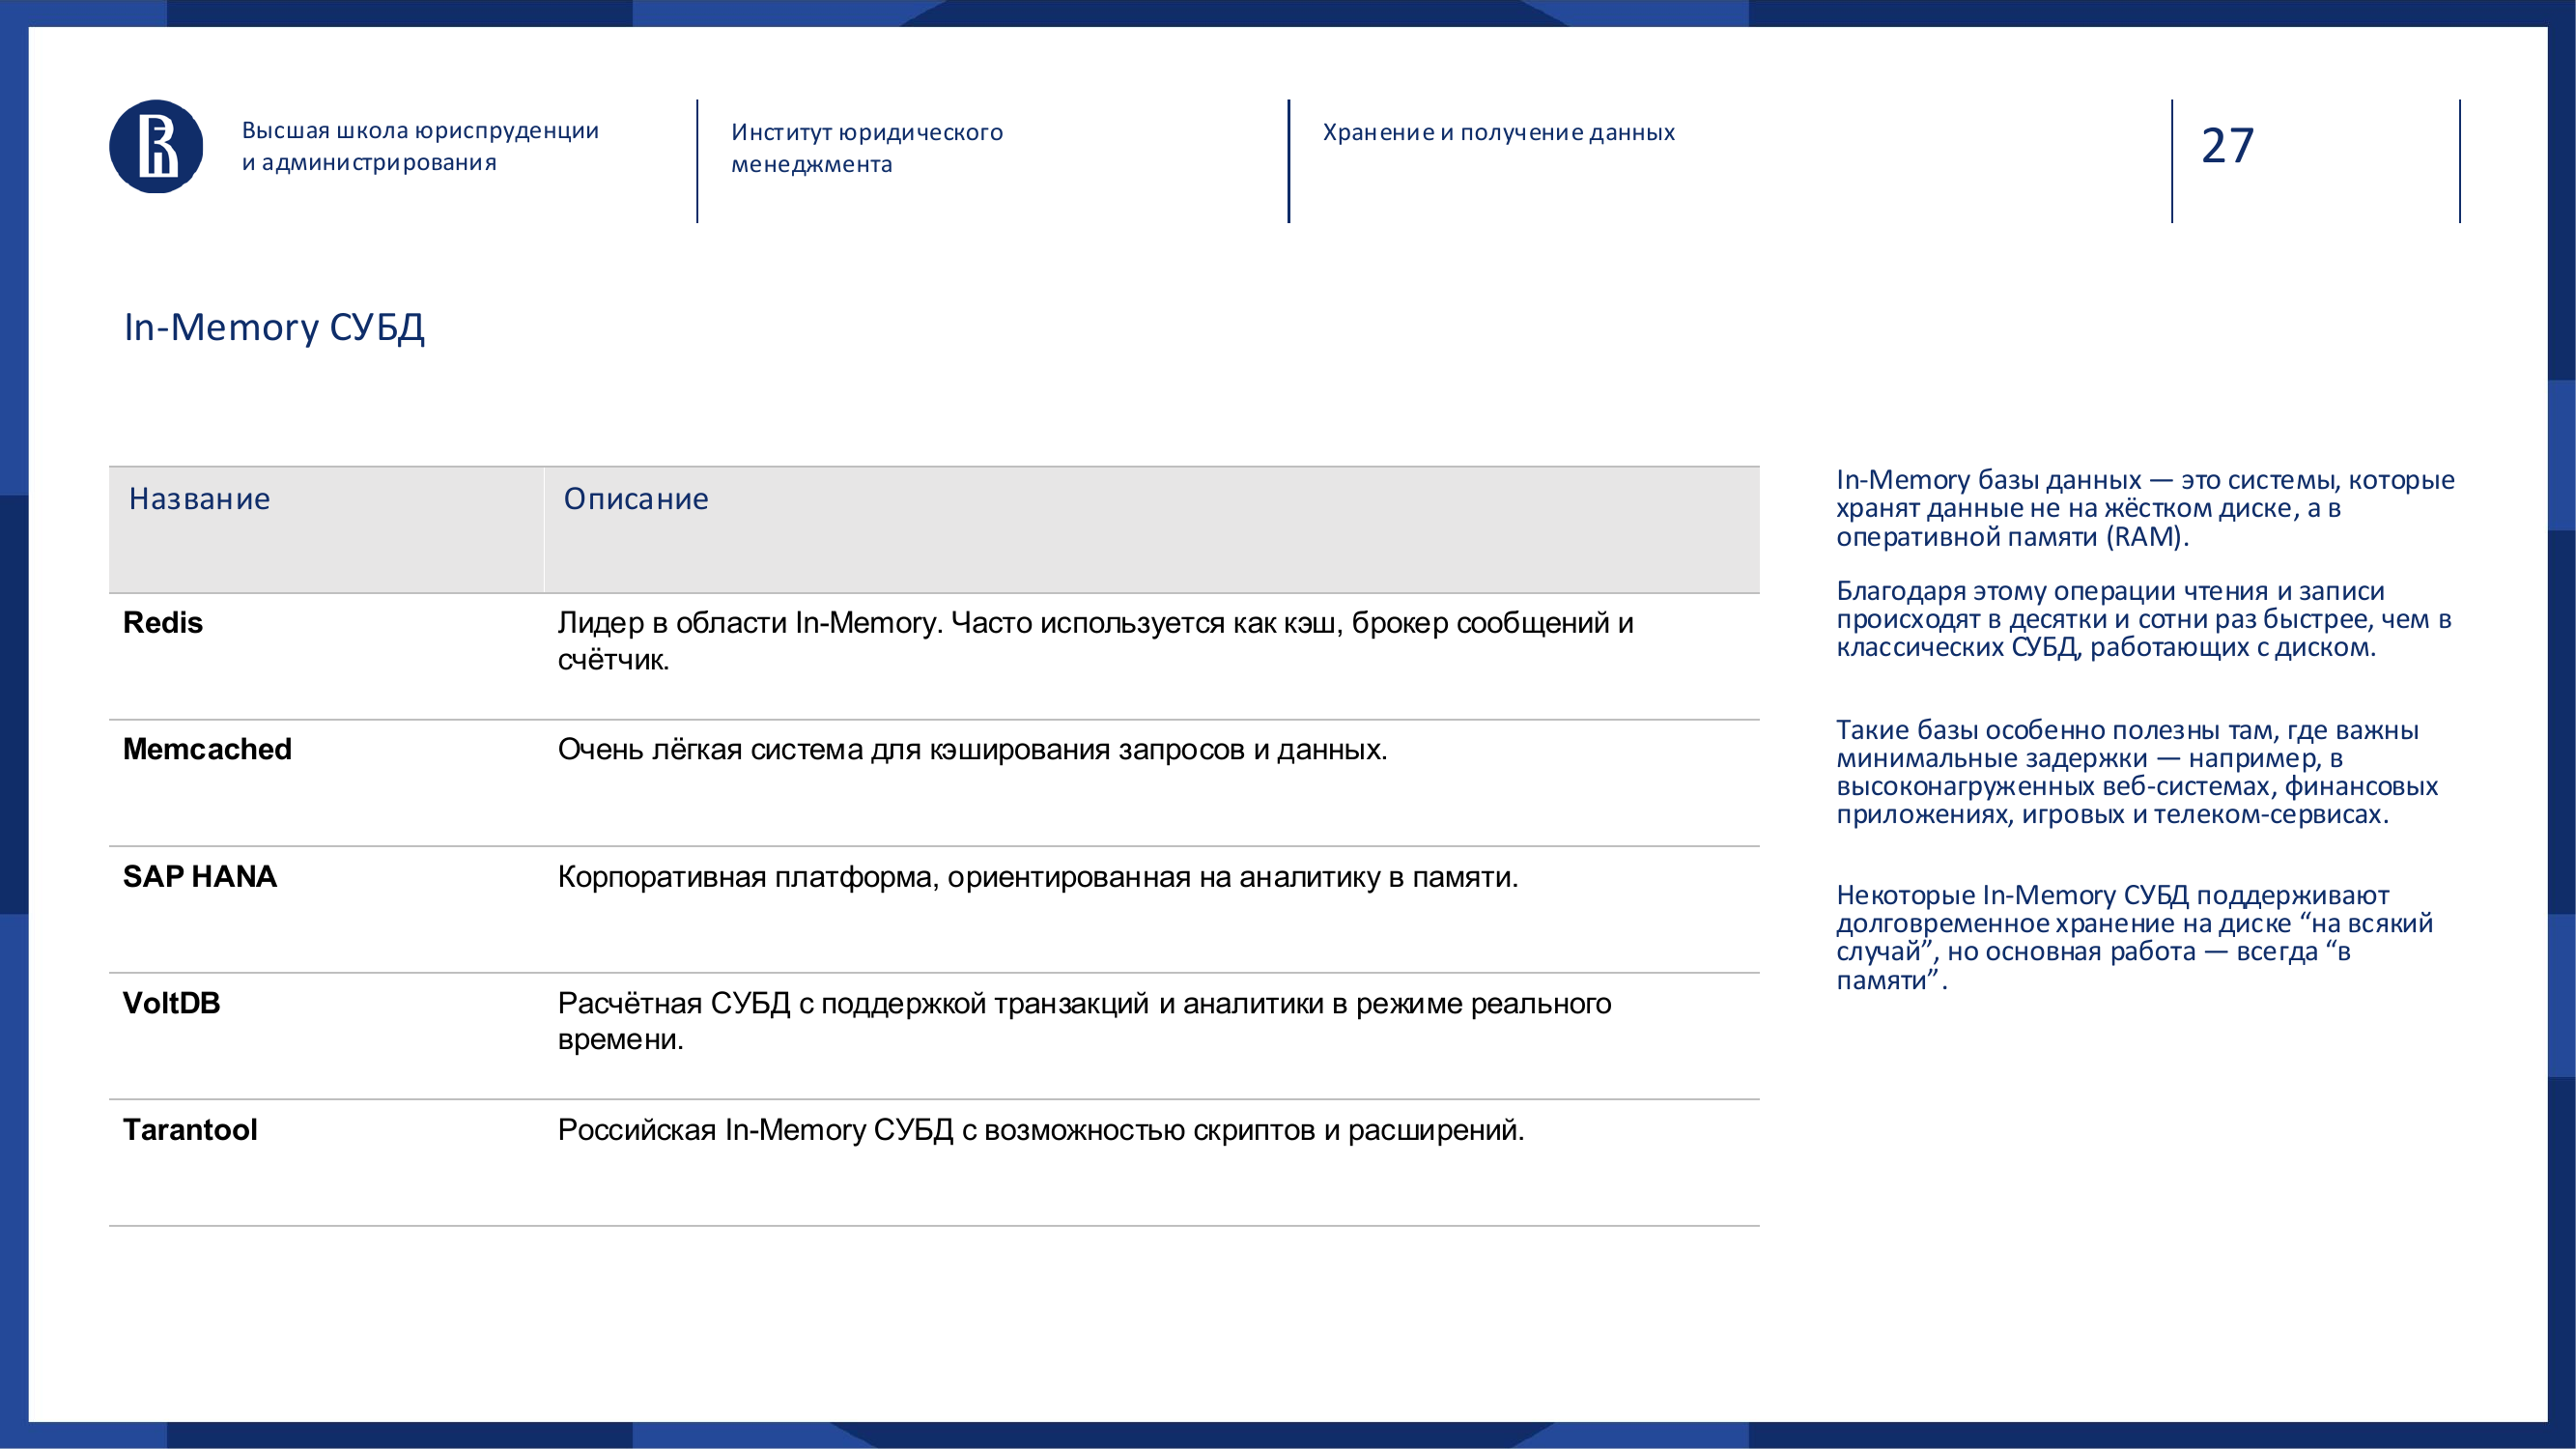
In-memory databases work mostly in RAM.
Examples: Redis, Memcached, Tarantool, SAP HANA.
They are needed where minimum latency matters.
Analogy: one thing is going to the archive every time for a folder. Another is keeping the needed documents right on the desk.
Such solutions are useful for cache, high-load services, real-time scenarios, fast customer profiles, telecom systems and financial systems.
### NewSQL 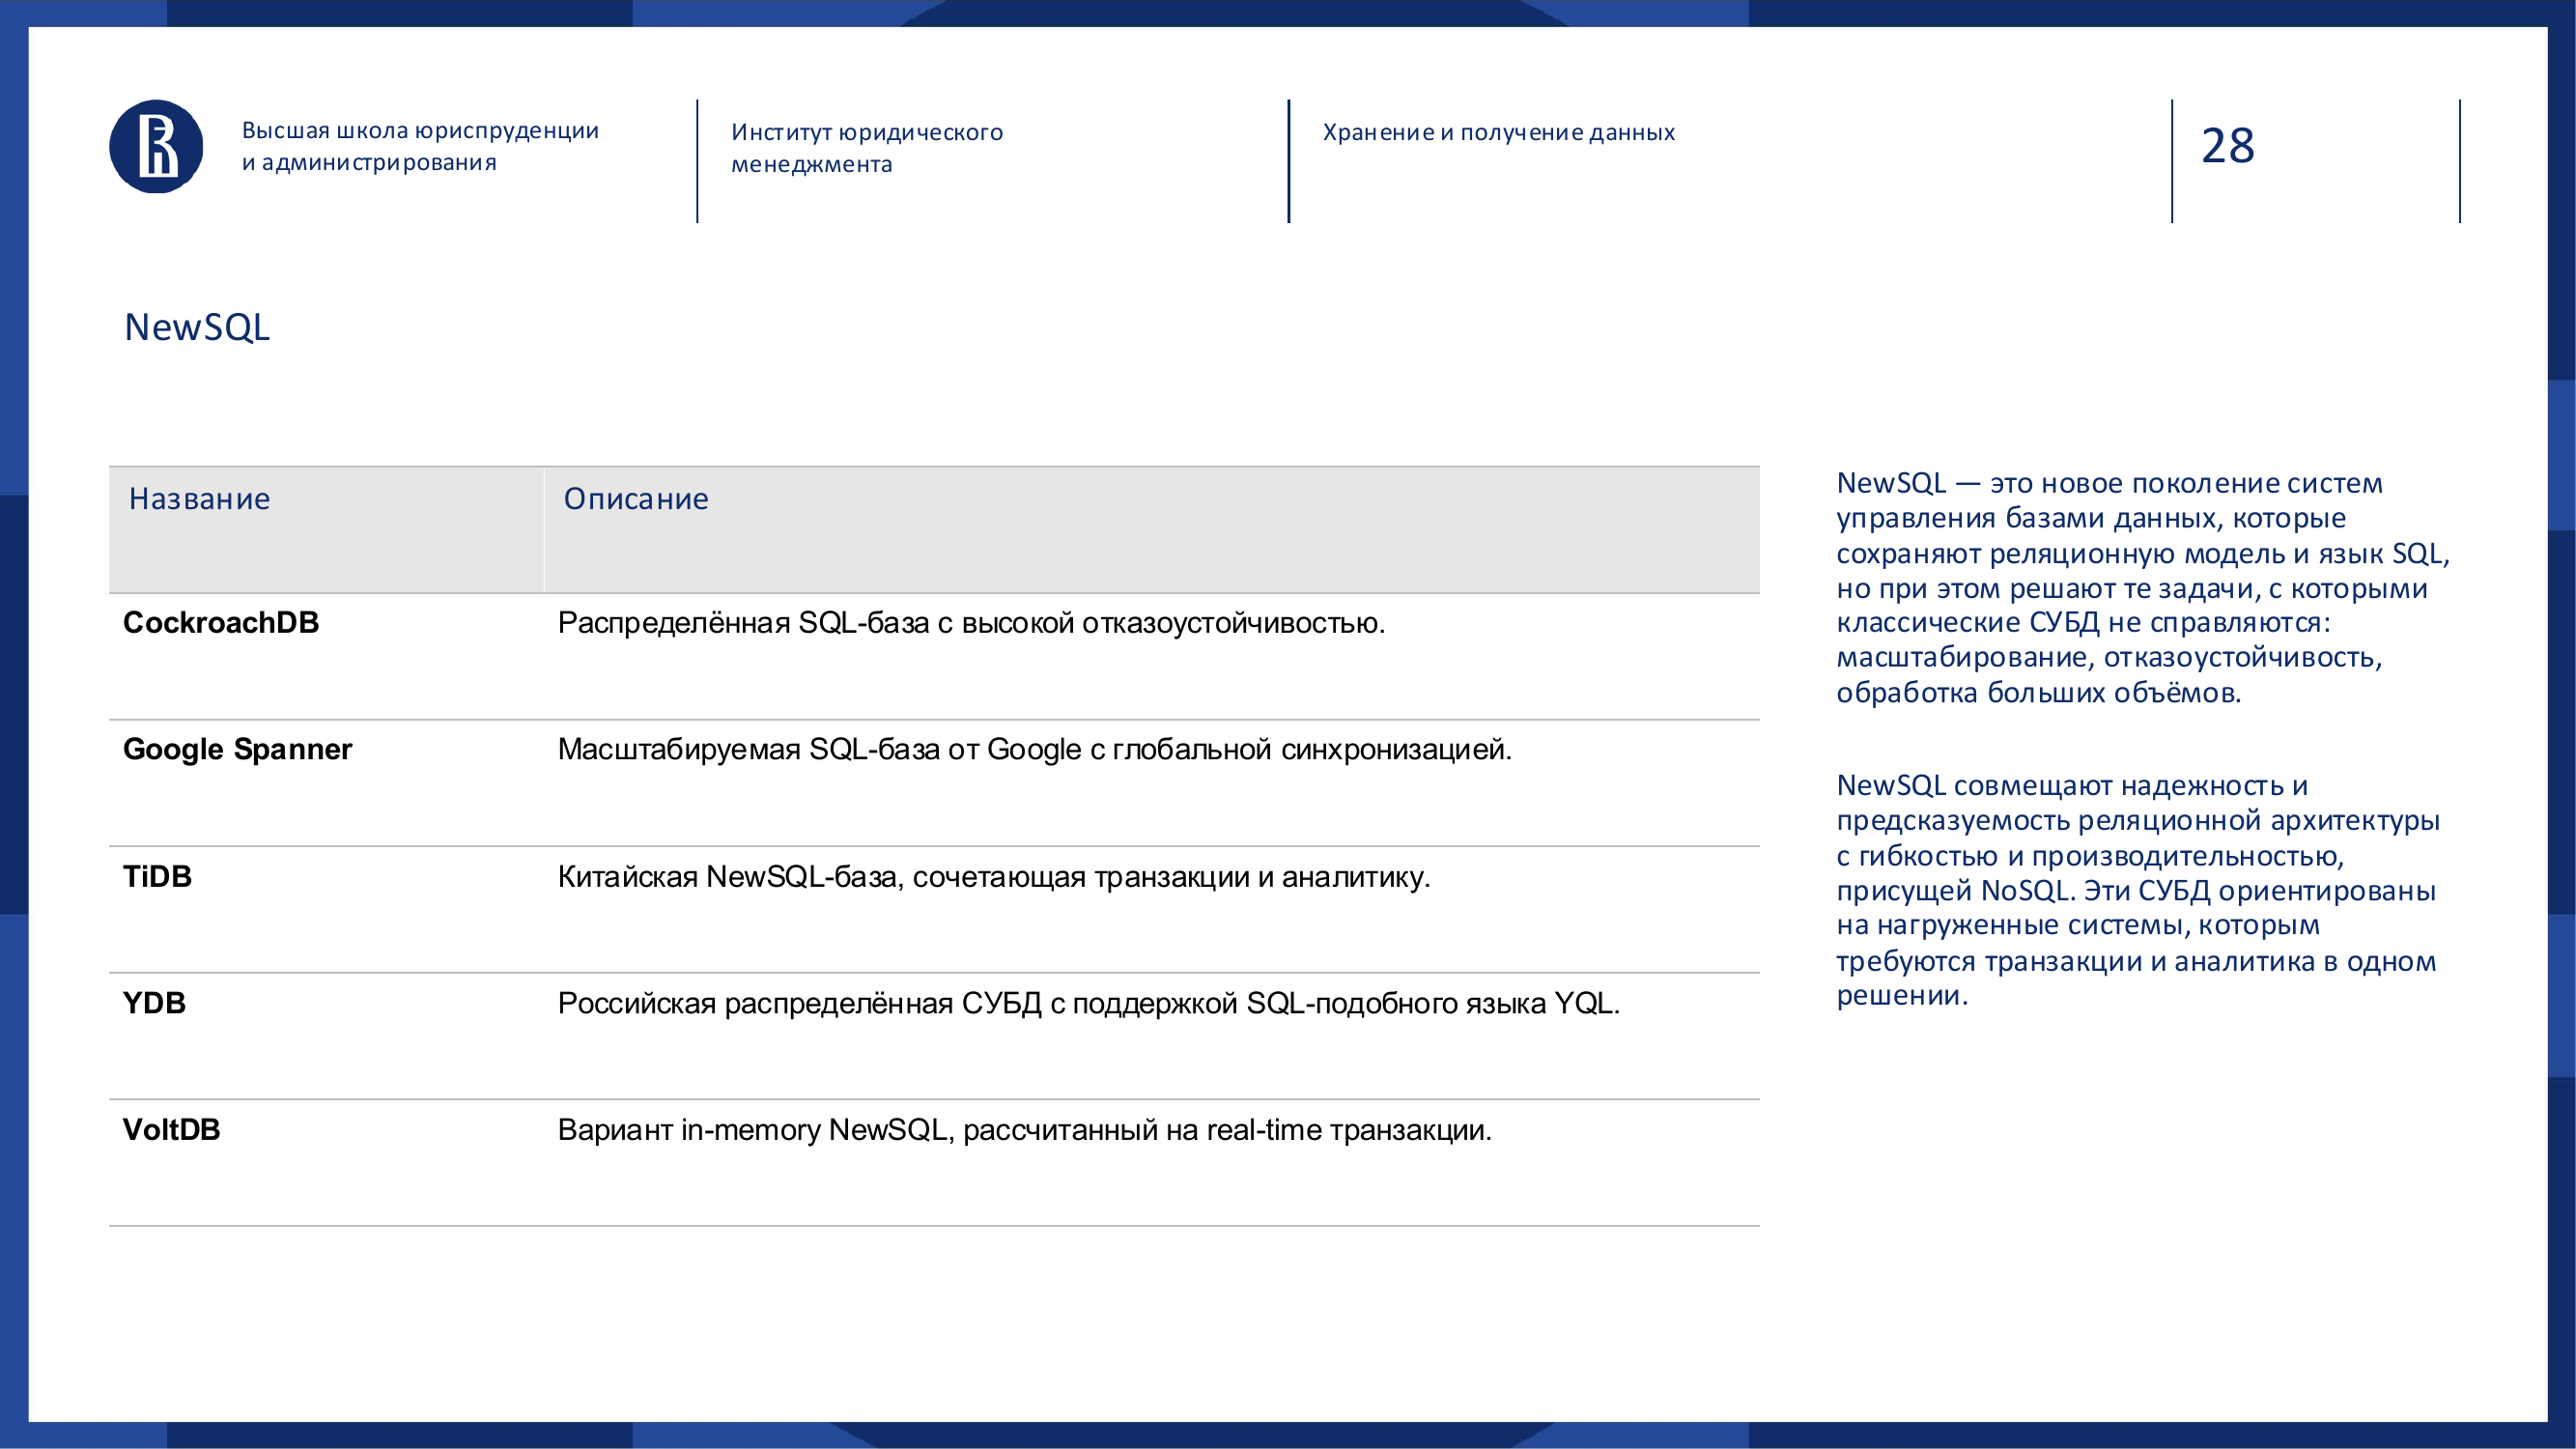
NewSQL is an attempt to keep the advantages of SQL and transactions, while adding the scalability of distributed systems.
Examples: Google Spanner, CockroachDB, TiDB, YDB.
NewSQL is needed when a classic SQL database no longer handles the scale, but the business is not ready to give up strict transactions and a clear data model.
It is like a classic car with modern internals: familiar SQL logic on the outside, distributed architecture inside.
---
Data storage architectures
A DBMS type is not yet an architecture. In reality, company data lives in different systems, moves between them, gets cleaned, aggregated and used by different teams.
That is why we need to talk about storage and data management architectures.
### Data Warehouse: a single version of truth 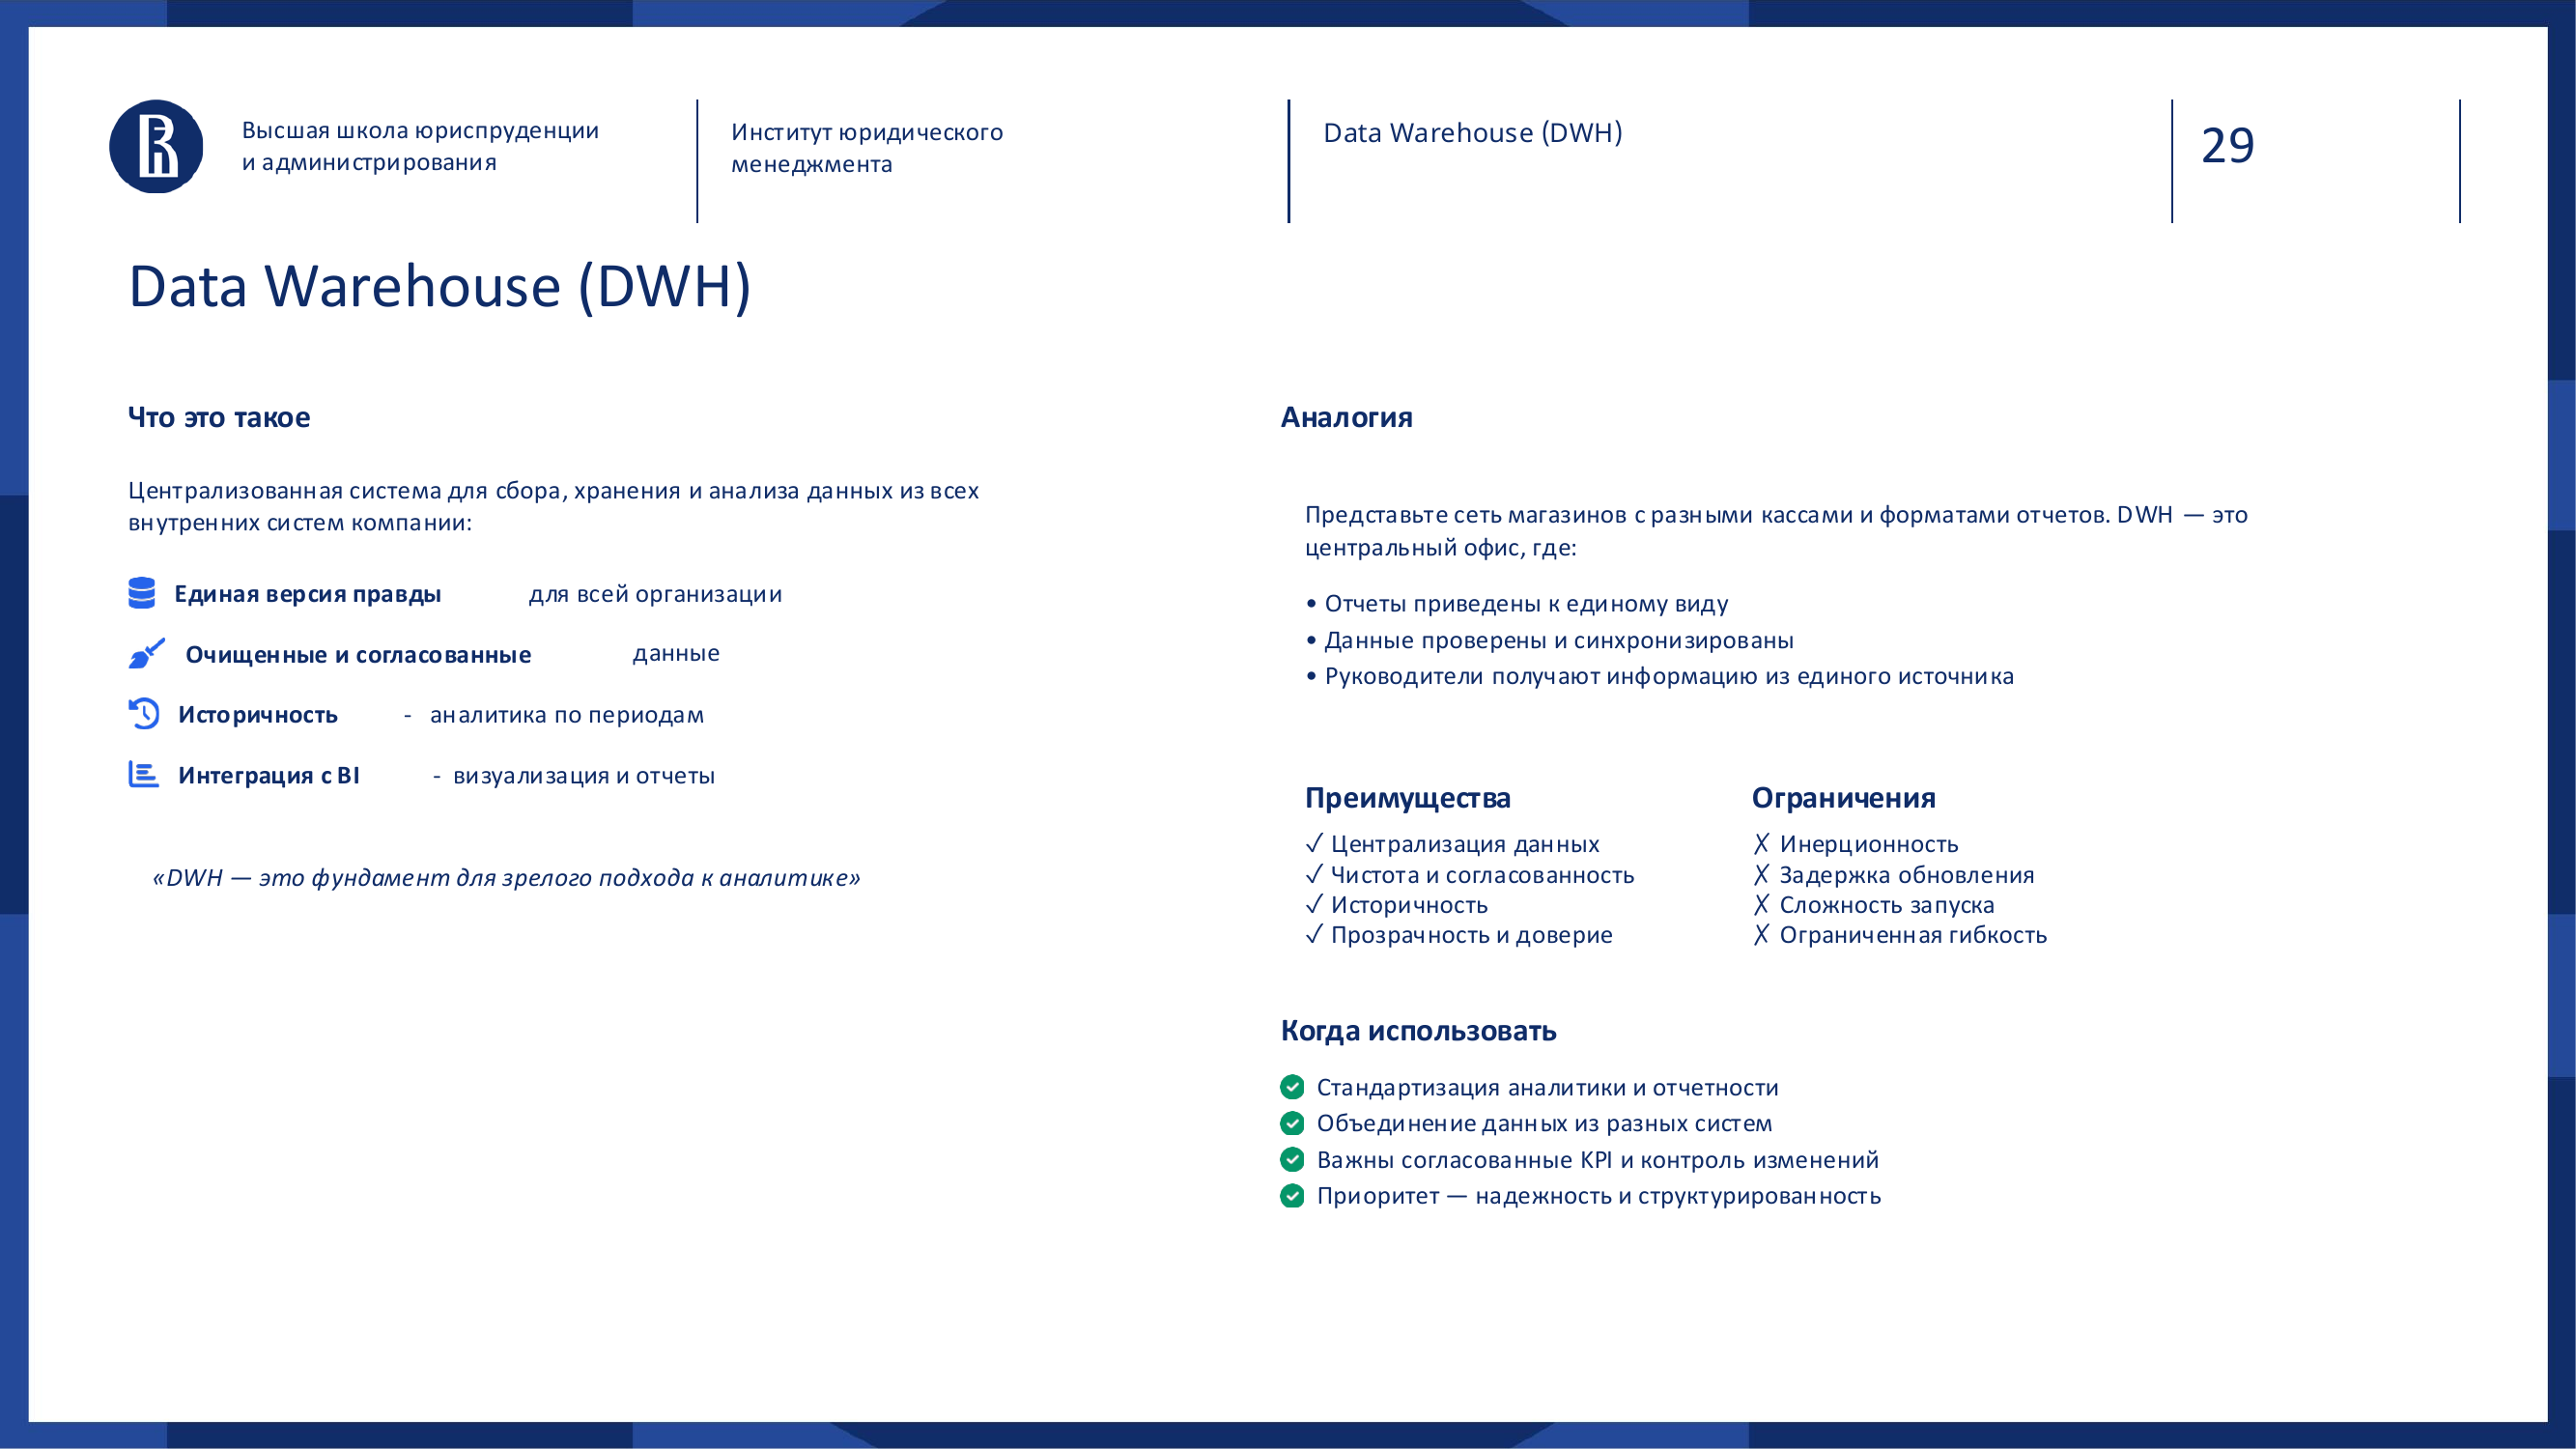
A Data Warehouse, or DWH, is centralized data storage for analytics and reporting.
Its job is to collect data from different systems, clean it, align it and give the business a single version of truth.
Analogy: a retail chain where every store has its own cash register and its own reports. The DWH is the central office where data is brought to one form, checked and used as the basis for management reporting.
DWH advantages:
- centralization;
- clean data;
- history;
- shared KPIs;
- trust in reporting;
- convenient integration with BI.
Drawbacks:
- launch complexity;
- inertia;
- update delay;
- limited flexibility with new data types.
A DWH fits well when a company needs regular management reporting, aligned metrics and data quality control.
### Data Lake: store everything as is 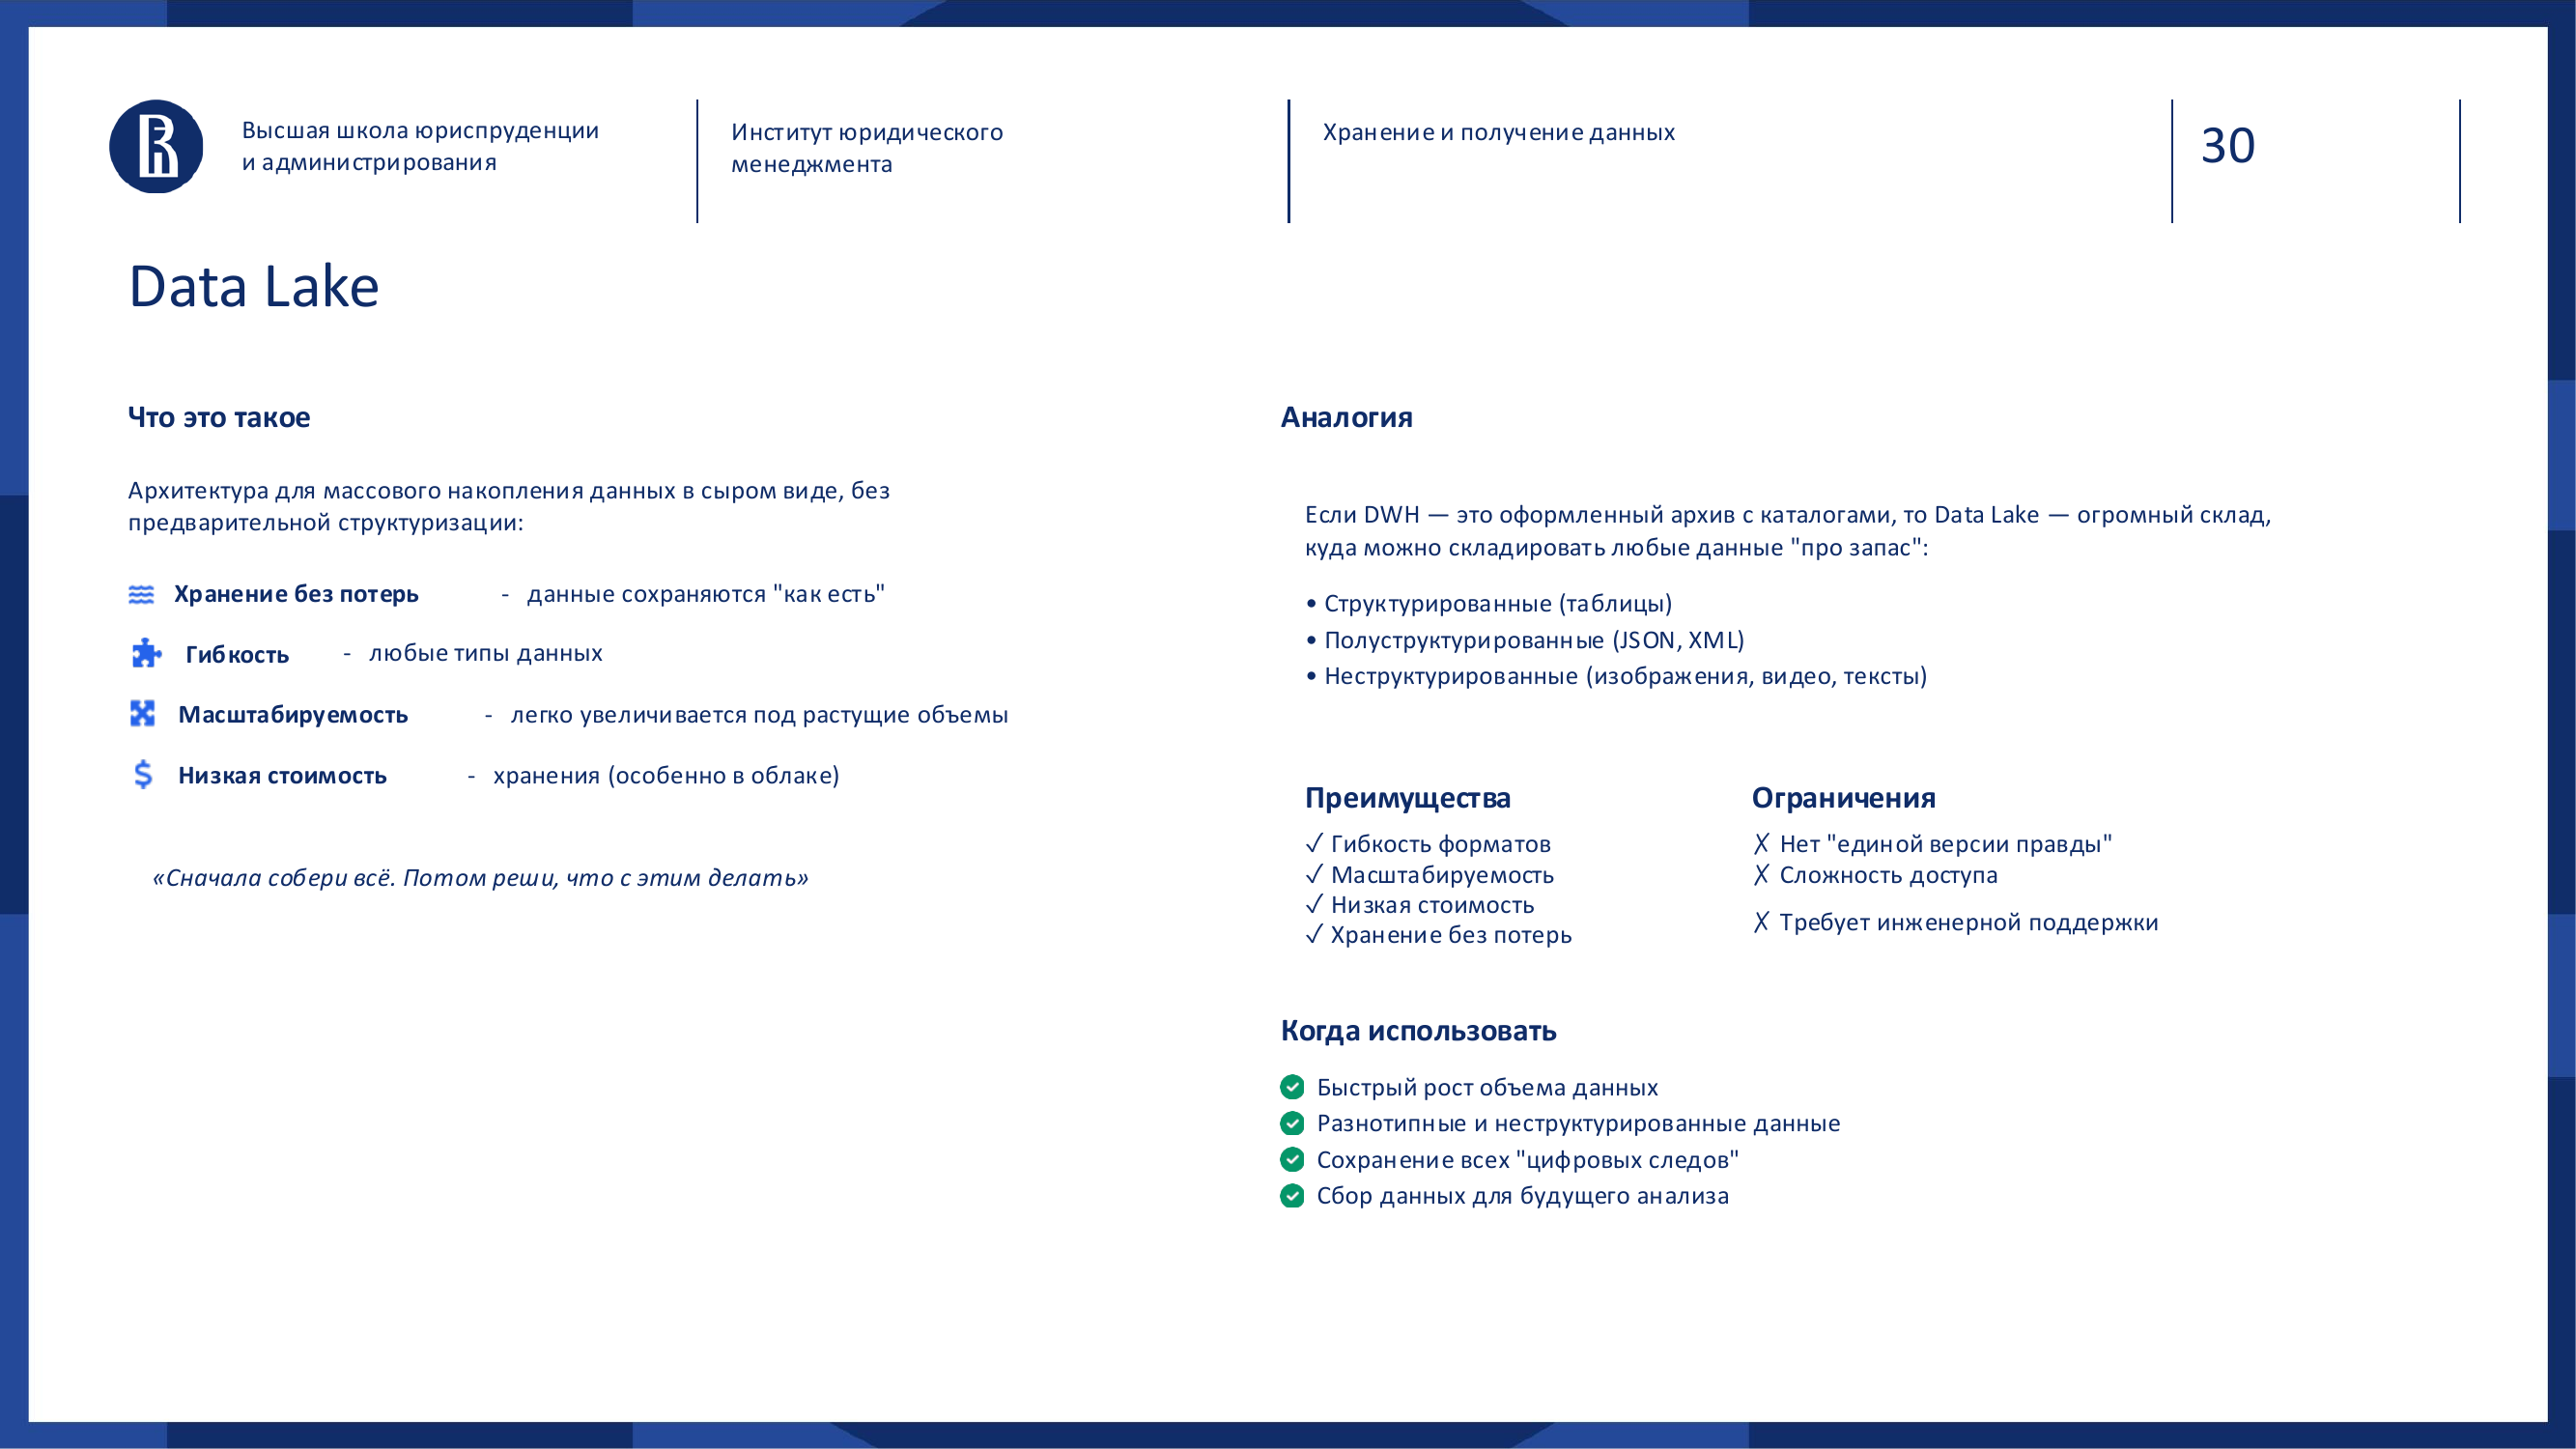
A Data Lake is an architecture where data is stored in raw form.
It can contain tables, JSON, logs, images, documents, audio, video and events.
Analogy: if a DWH is a formal archive with catalogs, a Data Lake is a huge warehouse where everything can be stored “just in case”.
Data Lake advantages:
- flexibility;
- scalability;
- support for any formats;
- low storage cost;
- ability to keep data before it is clear how exactly it will be useful.
Drawbacks:
- without management, it turns into a swamp;
- it can be hard to find the needed data;
- there is no single version of truth;
- engineering discipline is required;
- data quality is not guaranteed.
A Data Lake is useful when there is a lot of data, it has different types and it is not clear in advance which parts will be needed.
### Data Lakehouse: an attempt to combine order and flexibility 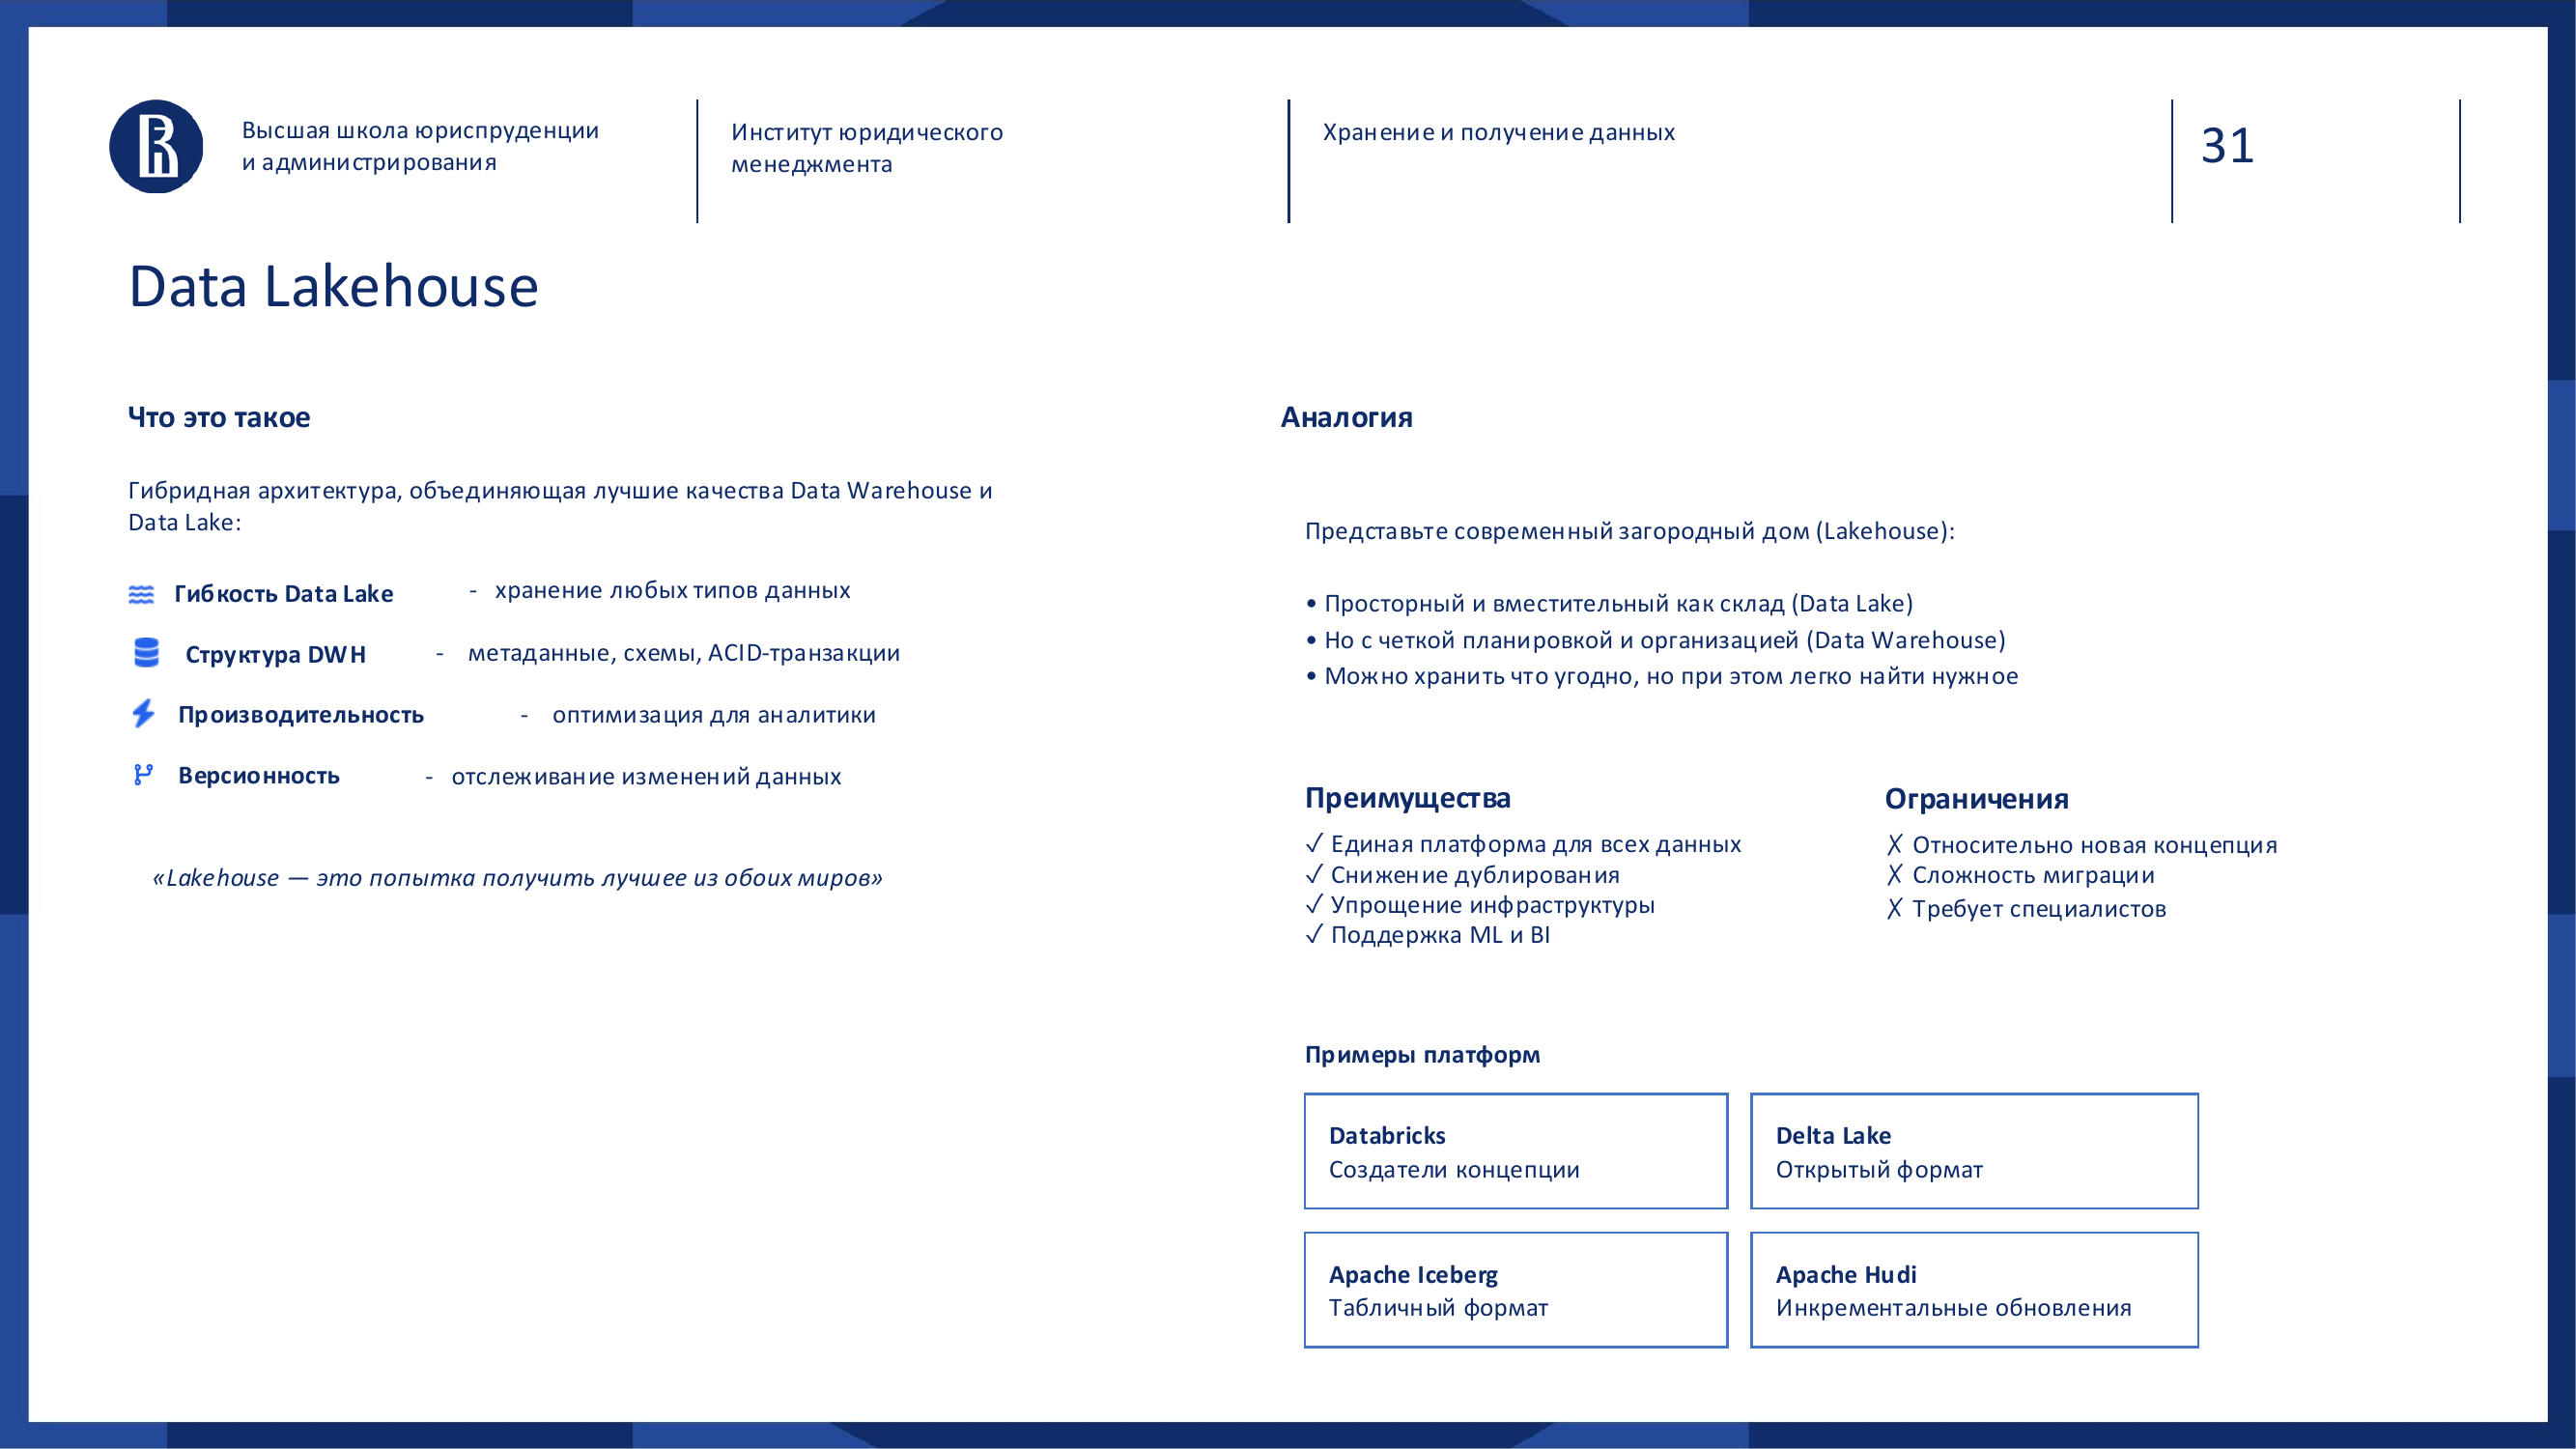
A Lakehouse is a hybrid of Data Lake and Data Warehouse.
The idea is to store data flexibly, as in a Data Lake, while adding structure, metadata, transactions and analytical convenience, as in a DWH.
Analogy: not just a warehouse where everything was dumped, but a modern logistics center. It can store different cargo types, but it has accounting, zones, rules, routes and a search system.
Lakehouse advantages:
- one platform;
- less duplication;
- support for BI and ML;
- work with different data types;
- faster path from data to analytics.
Drawbacks:
- the architecture is relatively new;
- it requires a mature team;
- migration can be difficult;
- discipline in metadata and processes is needed.
Lakehouse fits companies that have already hit the limits of DWH or Data Lake and want to combine flexibility with manageability.
### Data Mesh: data as a product 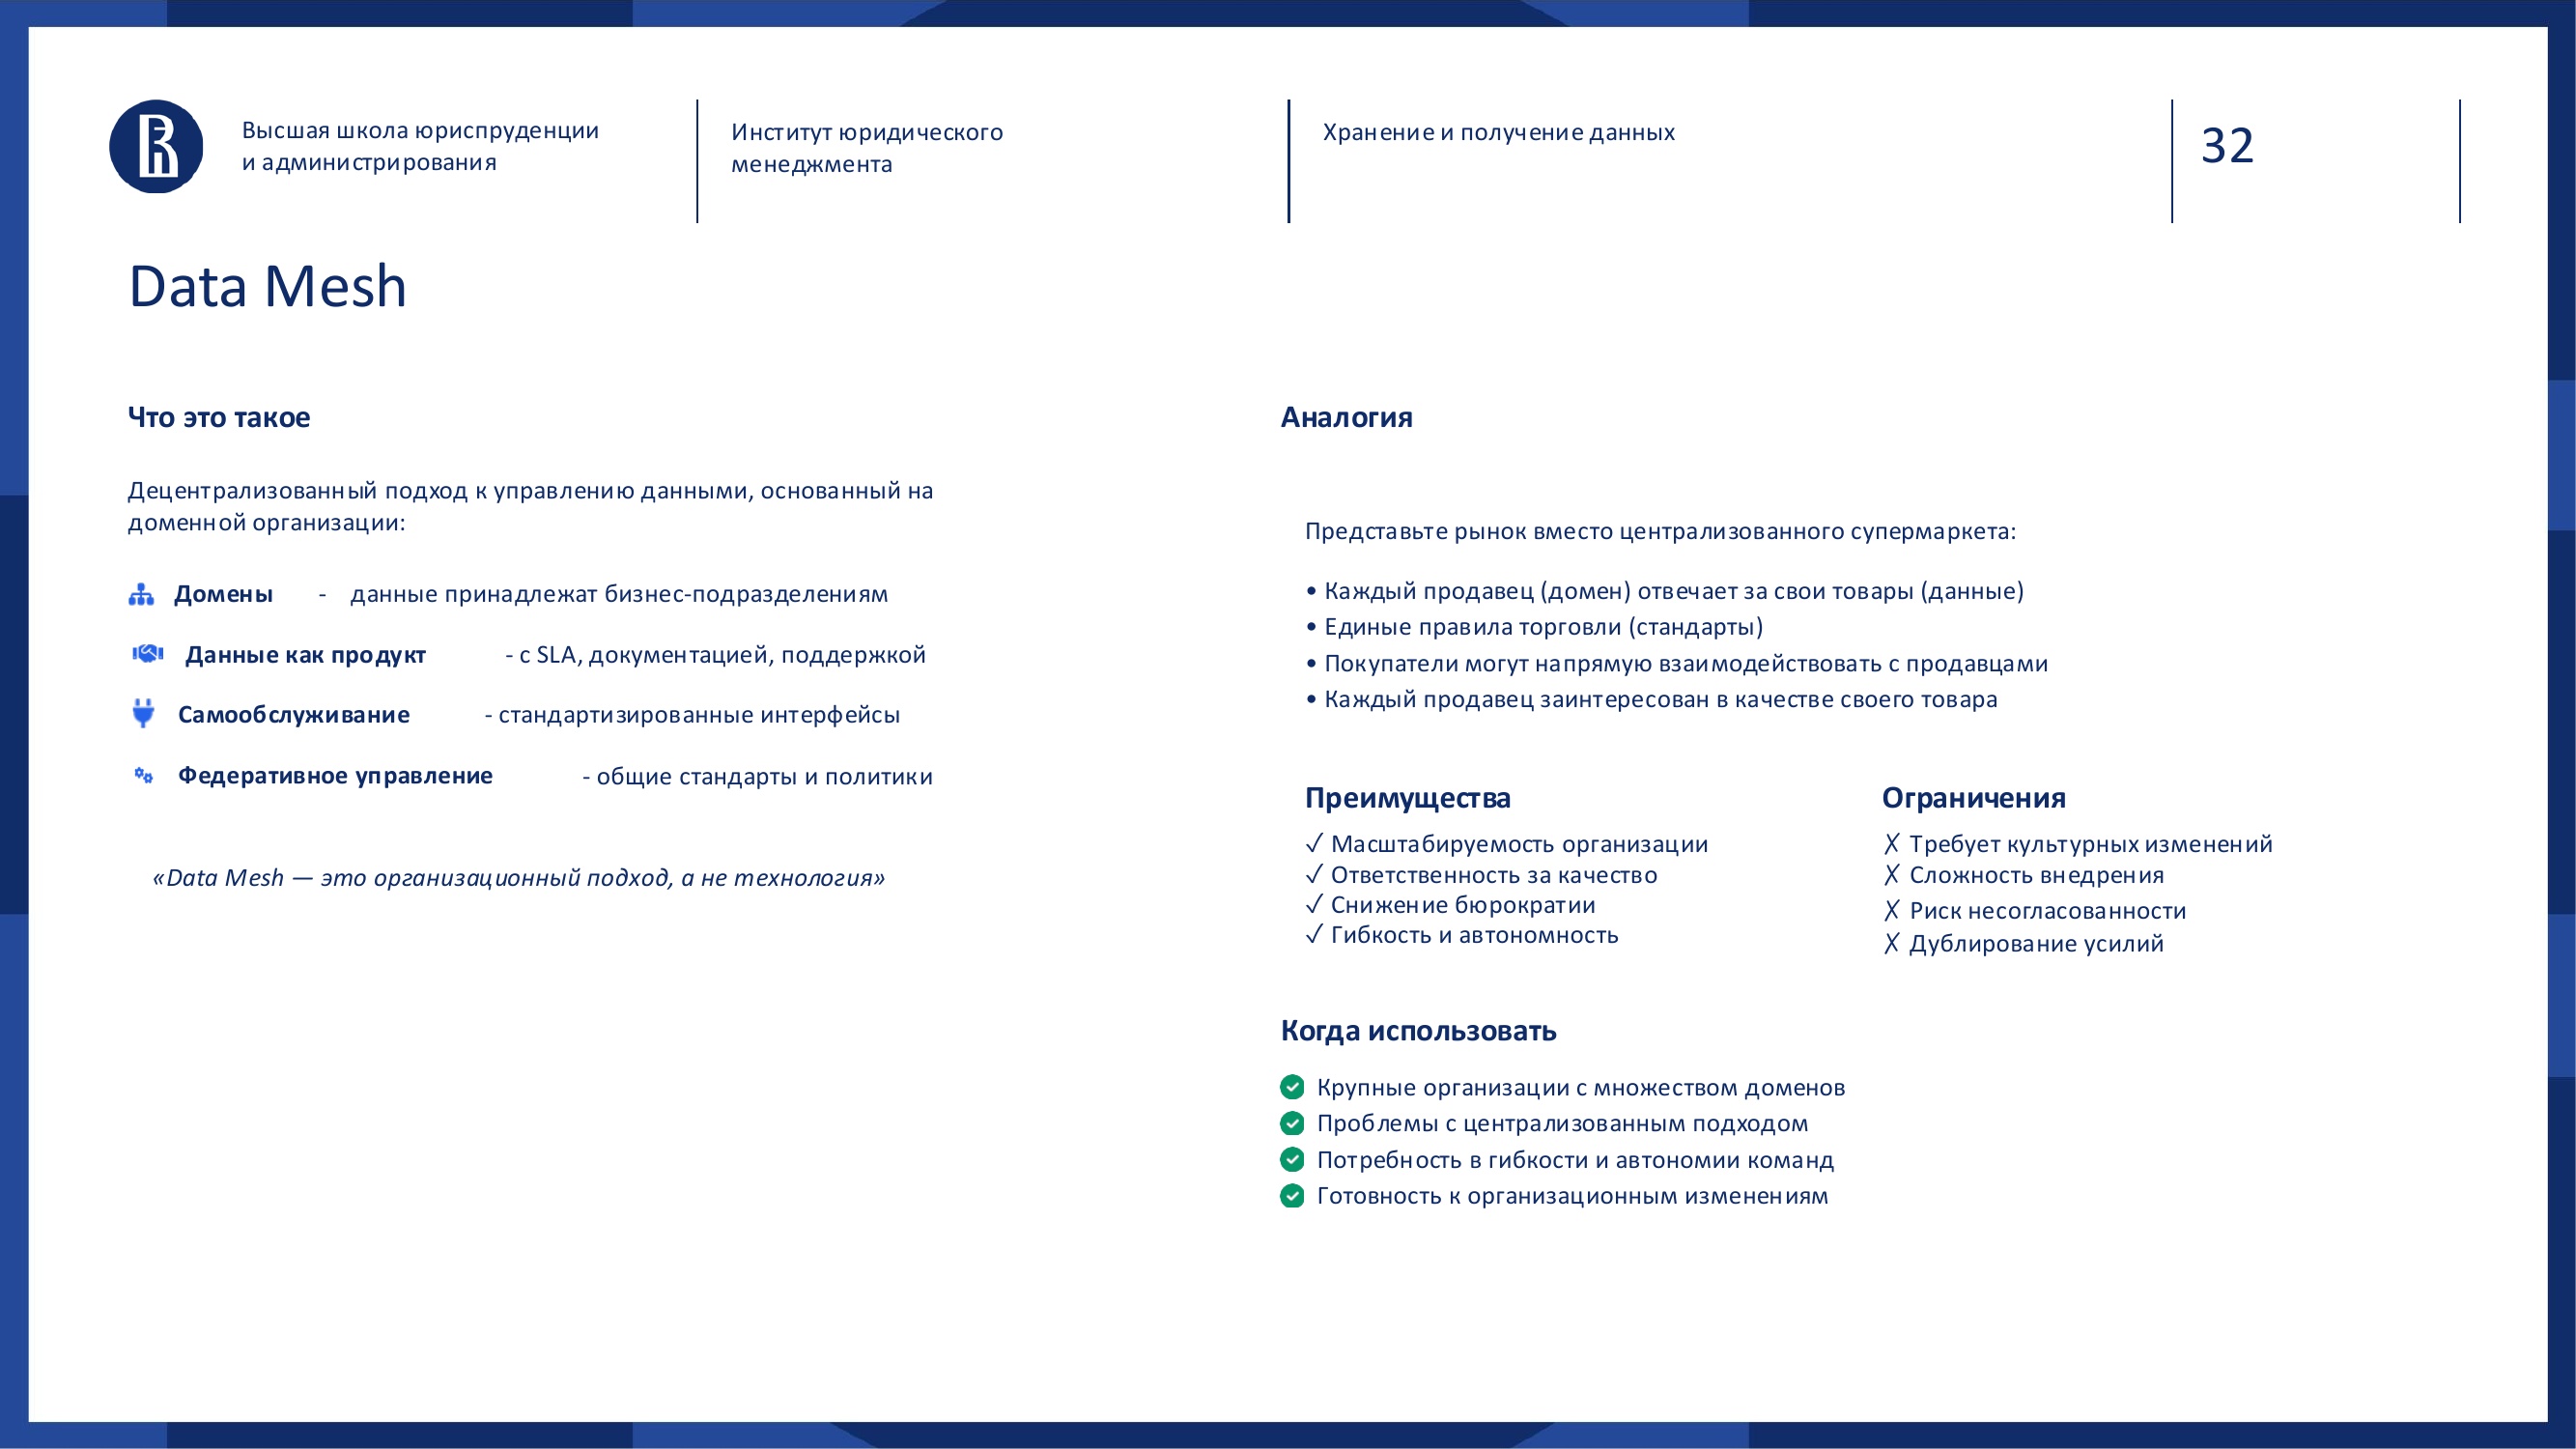
Data Mesh is more of an organizational approach than a specific technology.
Its idea is that data should belong to business domains. The team that creates and understands the data should be responsible for its quality, documentation and availability.
Marketing owns marketing data. Finance owns financial data. Logistics owns logistics data. HR owns HR data.
At the same time, everyone follows shared standards: security, access, quality, format and SLA.
Analogy: a market instead of one huge centralized warehouse. Each seller is responsible for their own goods, but the trading rules are common.
Data Mesh advantages:
- responsibility is closer to the source;
- fewer bottlenecks in the central team;
- better data quality;
- scalability for large organizations.
Drawbacks:
- high maturity is needed;
- a culture of responsibility is needed;
- inconsistency is a risk;
- standards and a self-service platform are needed.
Data Mesh fits large organizations where a centralized data team can no longer handle the number of domains and requests.
### Data Fabric: a unified access fabric 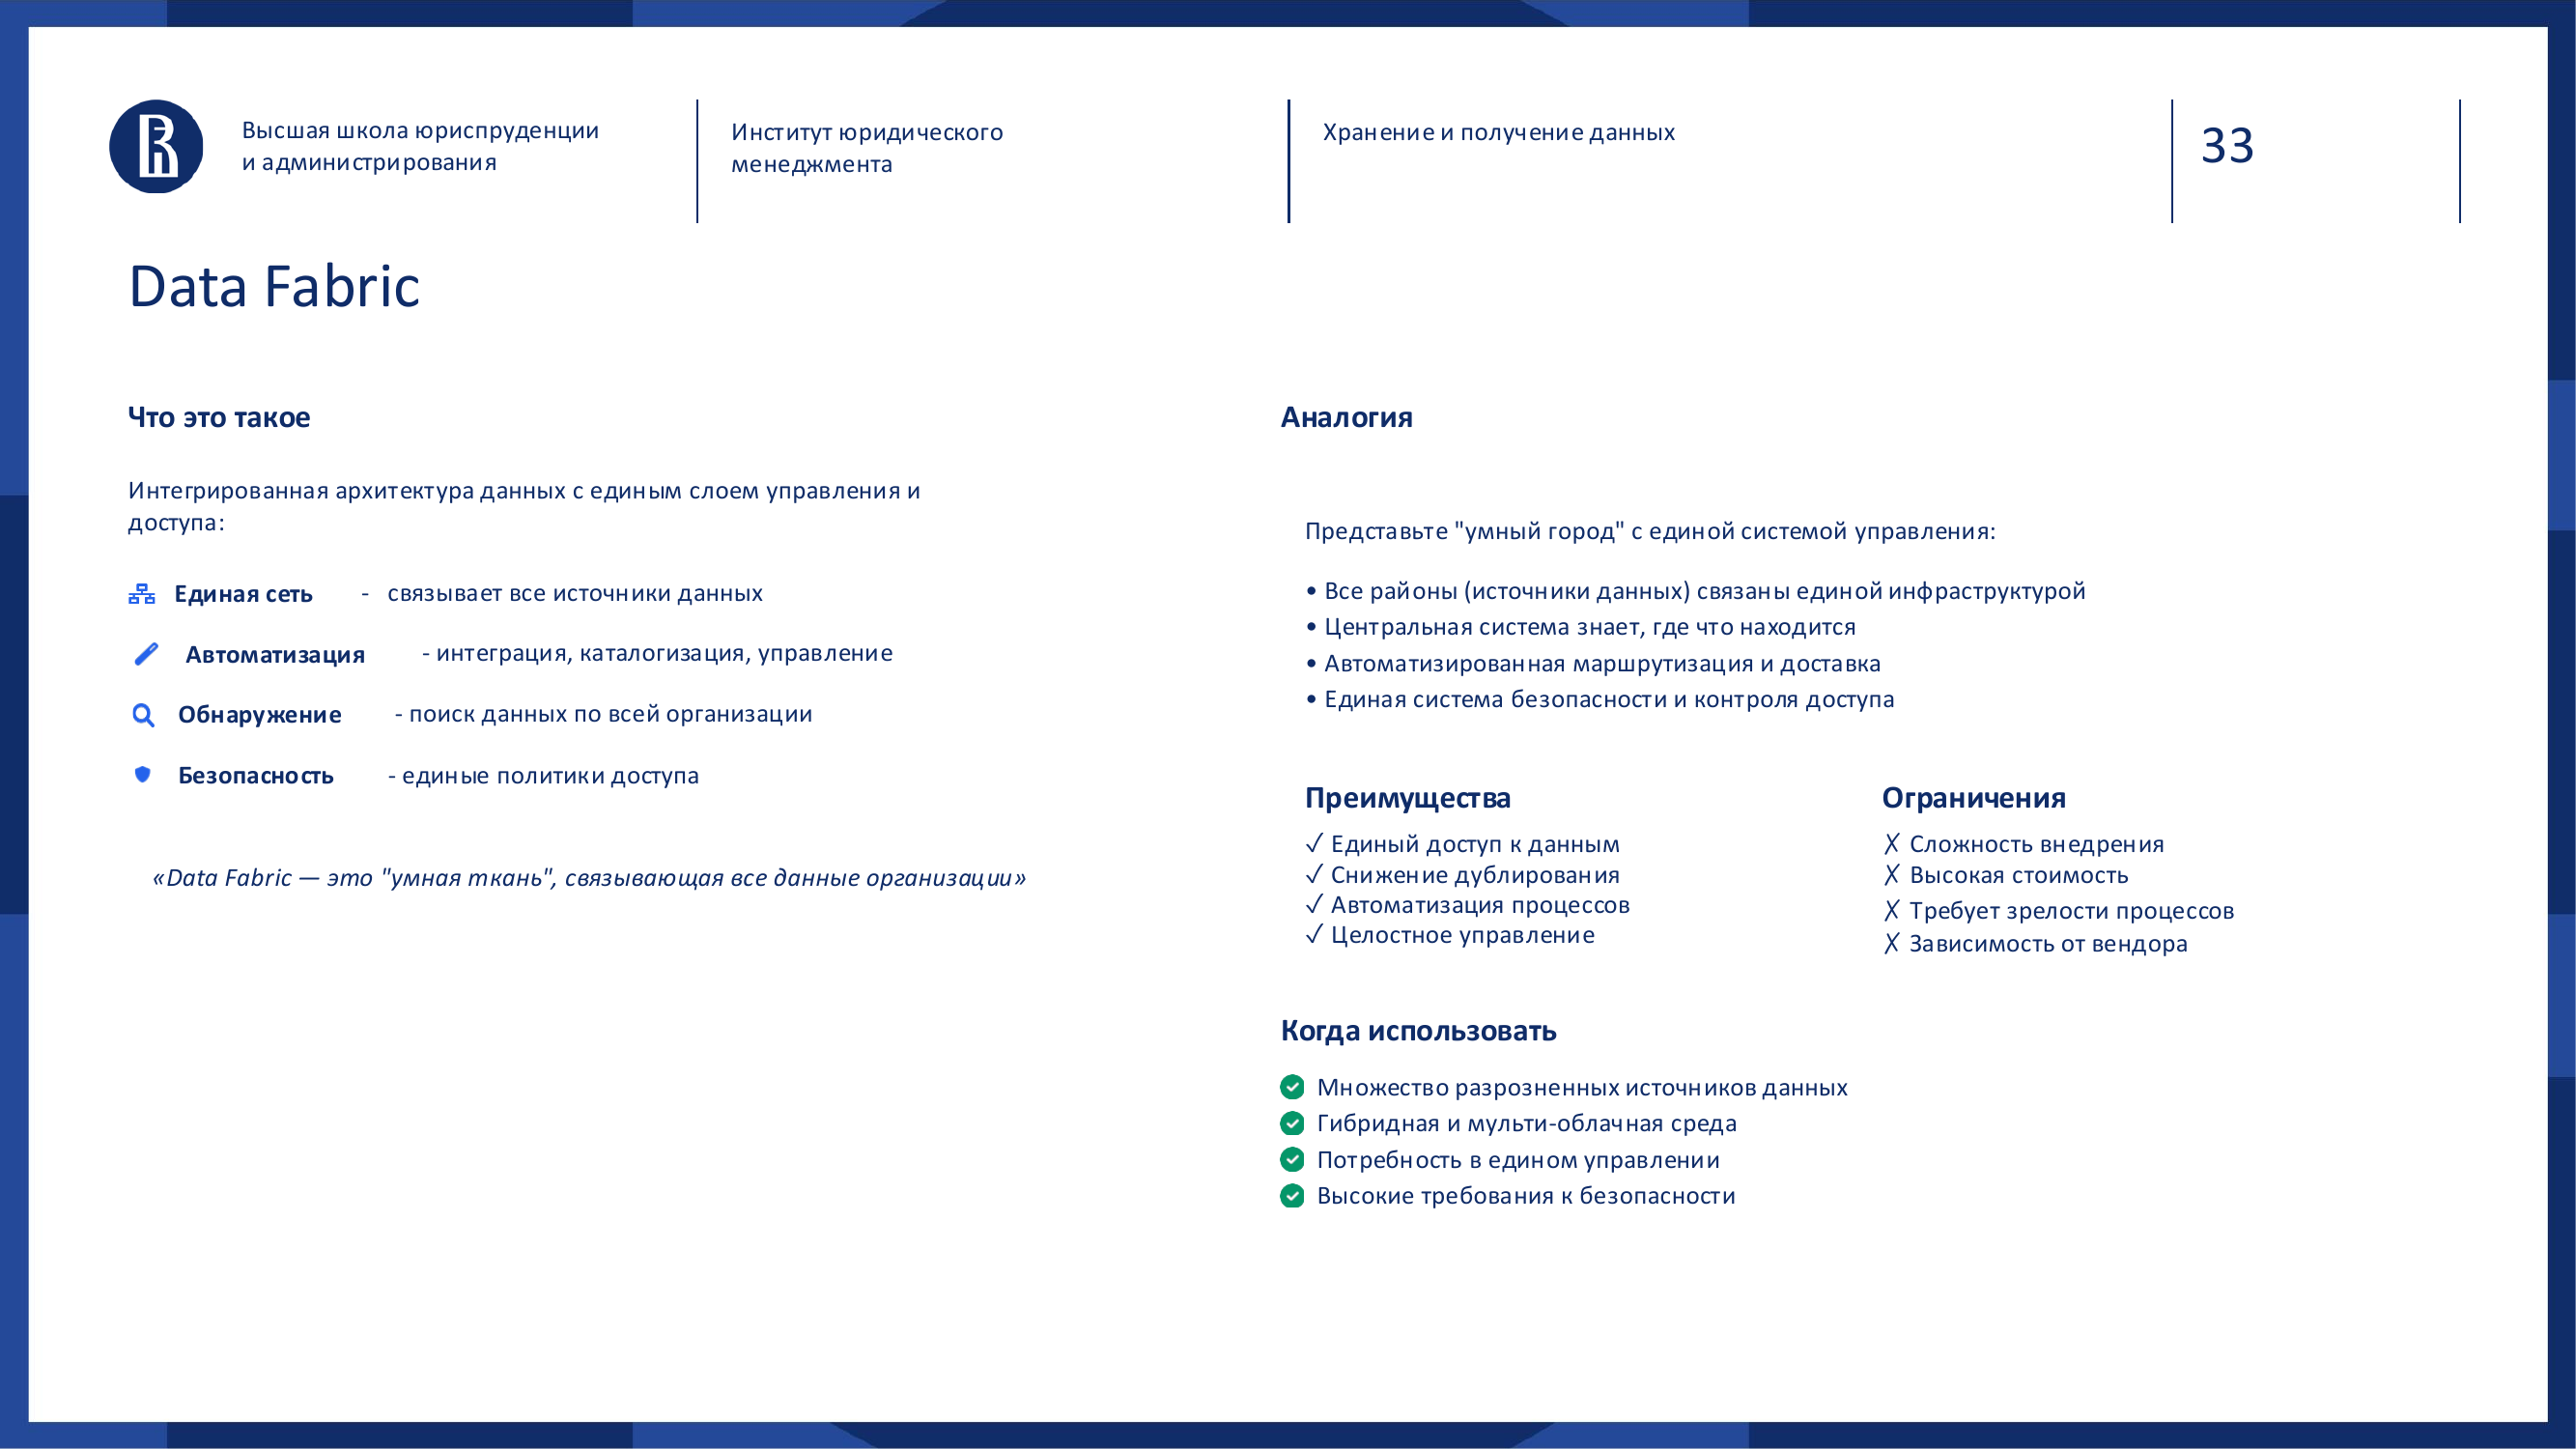
Data Fabric is an approach where a unified logical data access layer is created, even if the data is physically stored in different places.
Analogy: a smart city. Districts are different and systems are different, but there is a shared transport, information and control infrastructure.
Data Fabric does not necessarily move all data into one place. It connects sources, catalogs, access policies, metadata and processing tools.
Advantages:
- unified access;
- less duplication;
- automation;
- work with distributed sources;
- useful for hybrid and multi-cloud environments.
Drawbacks:
- complexity;
- high cost;
- dependency on tools;
- it does not solve data quality by itself.
Data Fabric fits companies that already have many systems, storage layers, clouds and sources, while the business needs unified access and governance.
### How to choose an architecture 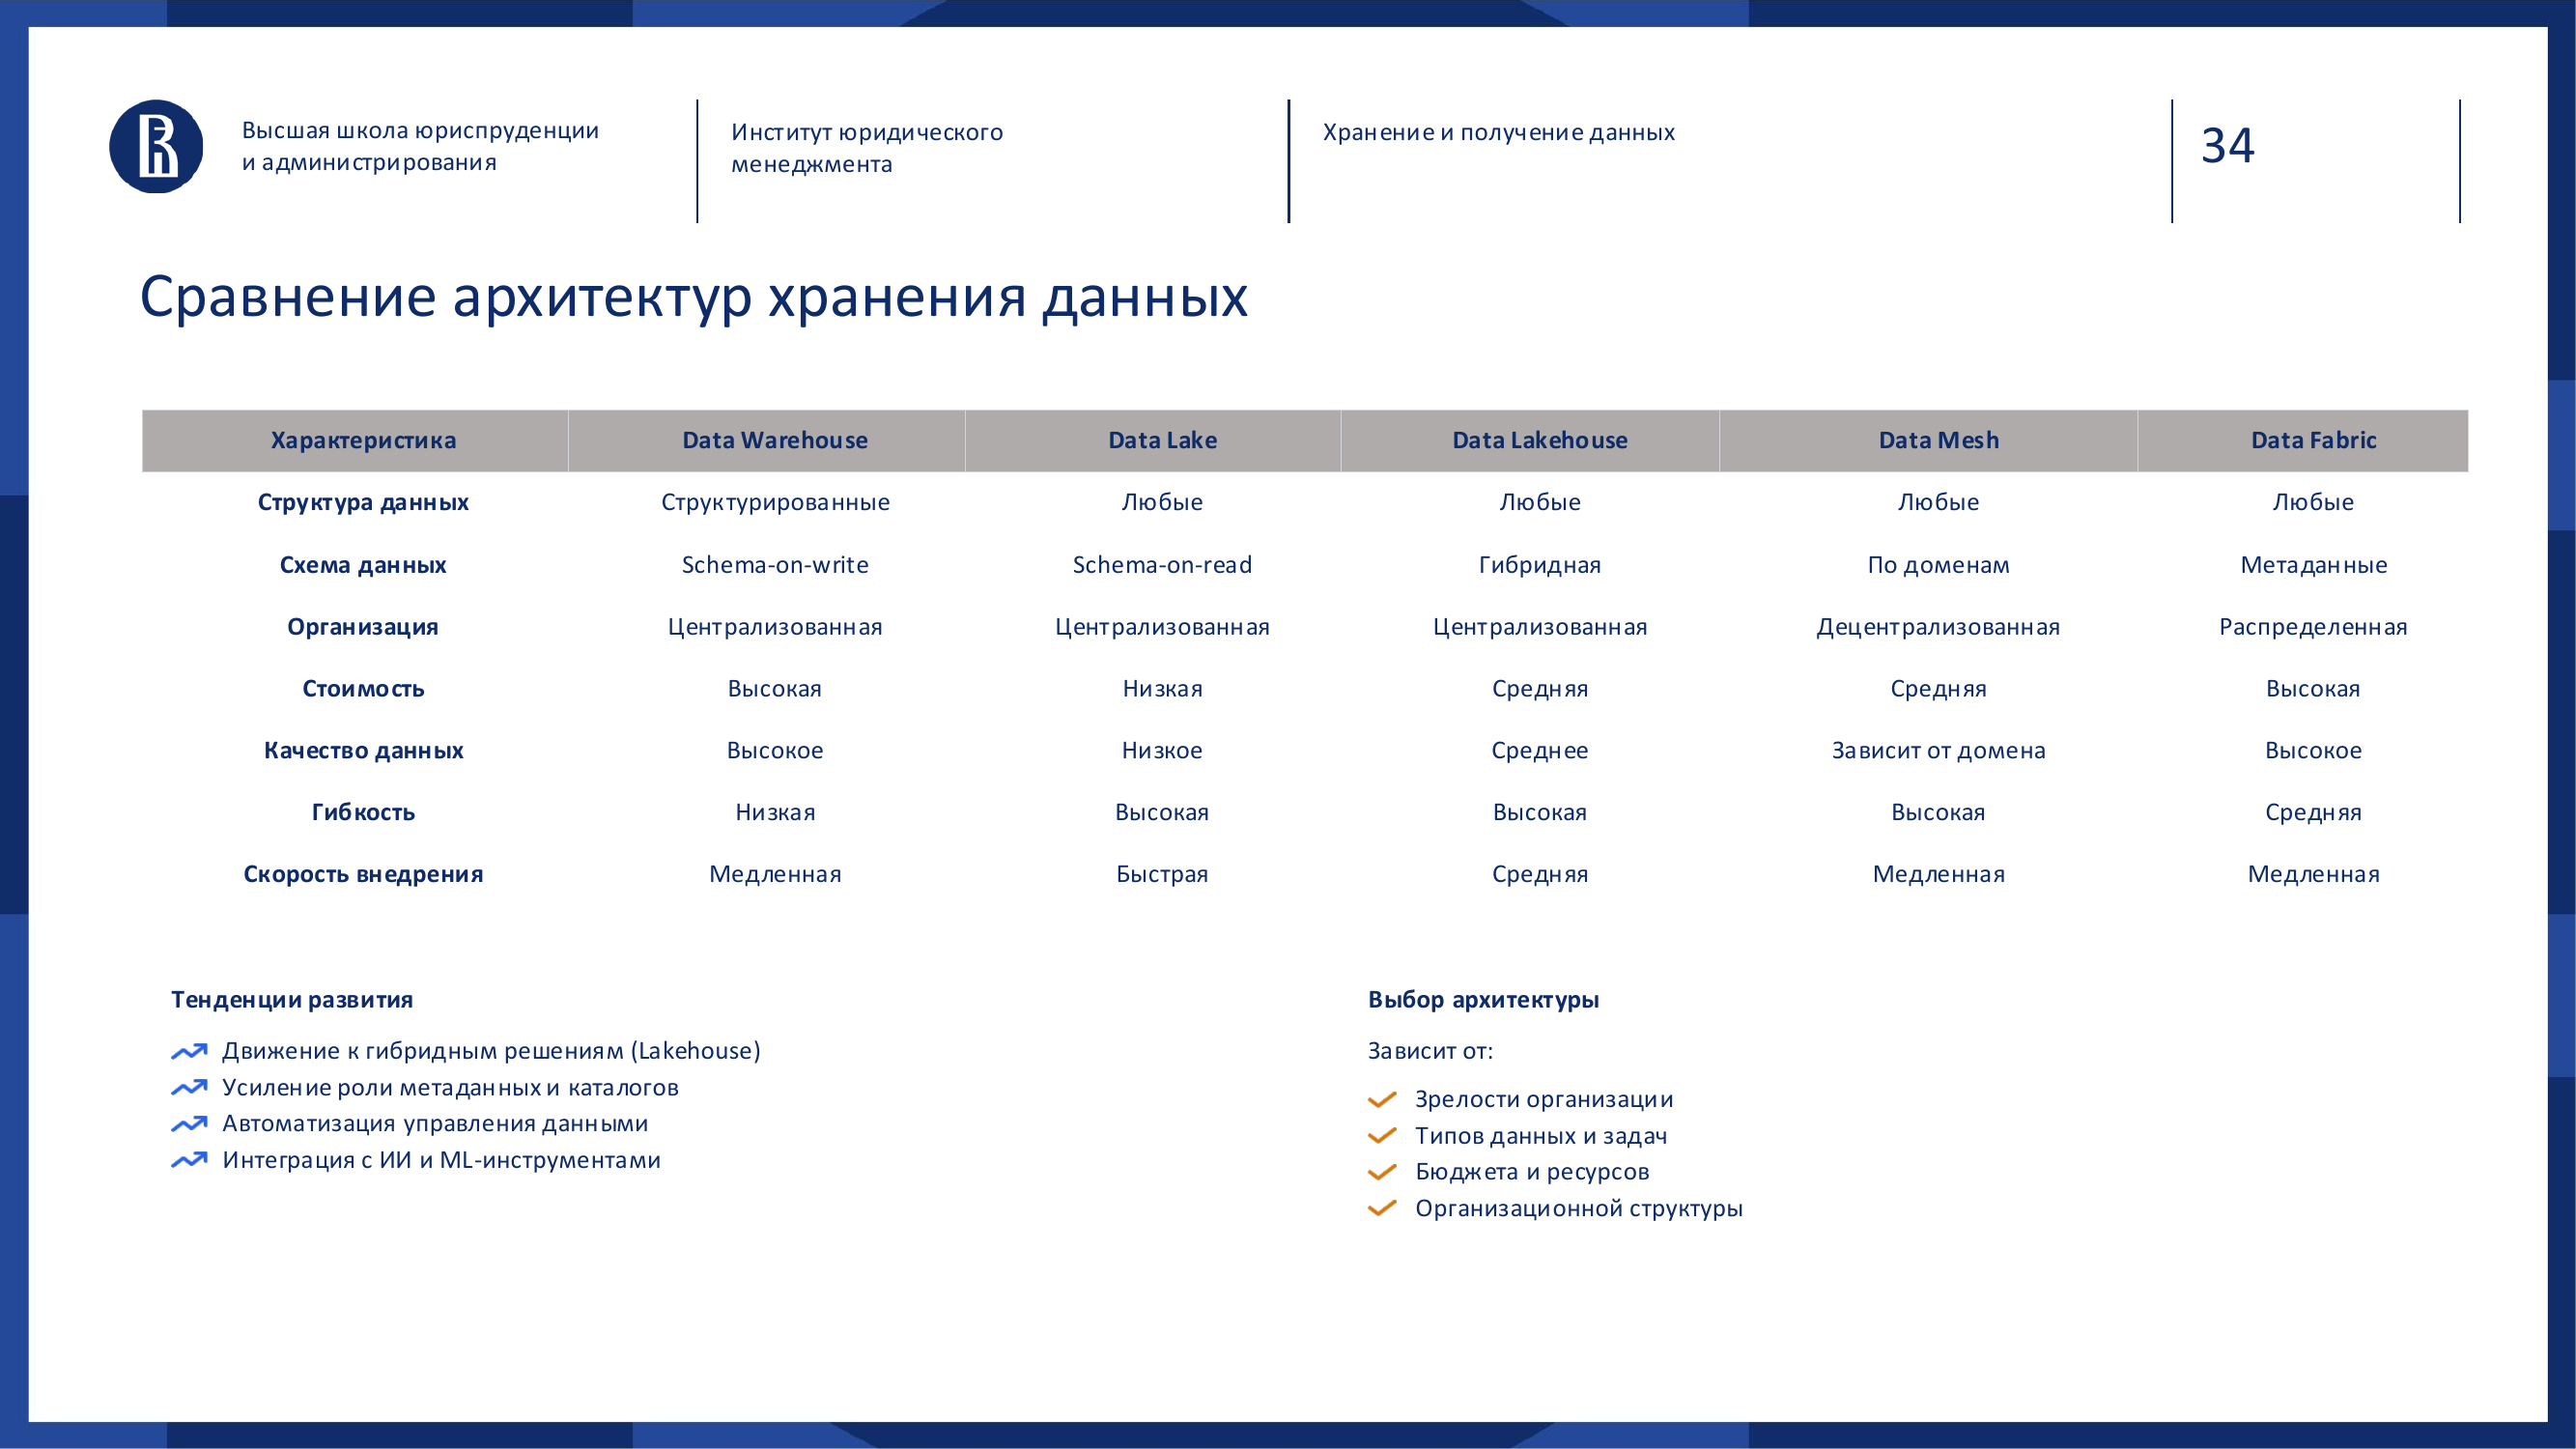
There is no best architecture in a vacuum.
| Architecture | When it fits | Main risk | |---|---|---| | DWH | Unified reporting and KPIs | Inertia | | Data Lake | Different formats and large volumes | Data swamp | | Lakehouse | BI, ML and flexibility in one layer | Implementation complexity | | Data Mesh | Many domains and teams | Inconsistency | | Data Fabric | Distributed sources | Platform dependency |
In short:
- DWH is needed when order and unified reporting matter.
- Data Lake helps when many different data types need to be stored.
- Lakehouse gives a balance between flexibility and analytical manageability.
- Data Mesh is useful when the organization is large and responsibility should be distributed by domain.
- Data Fabric fits when data is already distributed, but a unified access layer is needed.
The choice depends on company maturity, data types, tasks, budget, team and organizational structure.
> Questions for a manager > > - Which problem matters most right now: unified KPIs, experiment speed, access to distributed sources or domain responsibility? > - Is there a team that can support the chosen architecture after launch? > - What will get worse if everything stays as it is for another year?
---
DBMS import substitution: Russian solutions and the reality of choice
A separate topic that cannot be ignored in the Russian context is DBMS import substitution.
In recent years, it has become clear that dependence on foreign software is not only a technical risk, but also a strategic one. Limited access to updates, support, licenses, cloud services and documentation can suddenly become a business problem.
This is especially true for the public sector, financial organizations, critical infrastructure and companies with strict certification requirements.
Important: import substitution does not mean “urgently replace everything with the first domestic option”. It is a separate project where compatibility, workload, team, migration cost, support, ecosystem and regulatory requirements must be considered.
### Why consider Russian DBMS
Russian solutions have several potential advantages:
- compliance with regulator requirements;
- local technical support;
- lower sanctions risk;
- understanding of Russian specifics;
- availability of specialists and partners;
- possibility of certified deliveries.
But there are challenges too:
- functional limitations;
- need to retrain the team;
- migration cost;
- compatibility with existing systems;
- ecosystem maturity;
- availability of drivers, monitoring tools, backup, replication;
- real performance under a specific workload.
So choosing a DBMS is not a choice by a “ours / not ours” table. It is both an engineering and management decision.
### SQL / relational DBMS
The lecture material highlighted the following Russian or localized solutions in the relational DBMS segment. Before a real project, the exact certification status, versions and rights holders must be checked again, because this information changes.
| Name | Origin | Developer | Certification in the lecture material | |---|---|---|---| | Postgres Pro | PostgreSQL fork | Postgres Professional | FSTEC, FSB | | Jatoba | PostgreSQL fork | Gazinformservice | FSTEC | | Tantor | PostgreSQL fork | TANTOR Labs | FSTEC | | Proxima DB | PostgreSQL fork | OrionSoft | FSTEC | | Red Database | Firebird fork | RED SOFT | FSTEC | | Pangolin DB | Own development | SberTech | None listed | | Kvant-Hybrid | PostgreSQL fork | KVANTOM | FSTEC | | Arenadata Postgres | PostgreSQL fork | Arenadata | None listed | | SoQoL | Own development | RELEX | FSTEC | | Linter | Own development | NIP IVK | FSTEC, FSB |
One important observation: a significant part of Russian SQL solutions is built around PostgreSQL. This is logical. PostgreSQL is a mature open-source DBMS with strong expertise, extensibility and a large ecosystem around it.
For the business, this means that migration from foreign enterprise DBMS will not always be simple, but often there is an understandable path: compatibility analysis, schema migration, rewriting procedures, performance testing, high availability setup and team training.
### NoSQL and NewSQL
The lecture also highlighted Russian solutions and solutions with Russian roots in other DBMS classes:
| Name | Type | Origin / developer in the lecture material | |---|---|---| | ClickHouse | Column-oriented DBMS | Own development, ClickHouse Inc. / Yandex | | Qdrant | Vector DBMS | Own development, Qdrant Team | | Tarantool | In-memory DBMS | Own development, VK / ex-Mail.ru Group | | YDB | NewSQL | Own development, Yandex |
Here it is especially important not to mix different solution classes.
ClickHouse does not replace PostgreSQL in a transactional system. Qdrant does not replace a DWH. Tarantool is not a universal data archive. YDB solves distributed SQL workload tasks, but it requires a separate architectural assessment.
Each of these systems is strong in its own class of tasks.
ClickHouse is for analytics and fast aggregations. Qdrant is for vector search and AI scenarios. Tarantool is for high-load in-memory scenarios. YDB is for distributed SQL workloads and scaling.
### How to approach import substitution
You should not start with the question: “What should we replace Oracle with?”
It is better to move step by step.
First, describe the current landscape:
- which DBMS are used;
- which systems depend on them;
- what workloads they carry;
- which SLA are required;
- what integrations exist;
- which procedures, functions and extensions are used;
- which data is critical;
- which certification requirements apply.
Then divide systems by criticality.
Not all databases are equally important. There are experimental systems, reporting systems, customer services and the core of the business. Core migration is always a separate project with tests, a fallback plan and long preparation.
Then run a pilot.
Not a vendor presentation, but a real pilot on your data and your workloads.
Only after that should the decision be made.
Import substitution is not a one-time purchase. It is a program for changing the technology landscape.
---
Vector databases and AI
Now let's move to a topic that has become especially relevant in recent years: vector databases and their connection to artificial intelligence.
When we talk about classic databases, we usually mean exact search.
Find the customer with ID 123. Show order number 456. Select payments for March. Filter products in the “electronics” category.
But in real life, we often need not exact search, but semantic search.
Find similar customer requests. Show documents close to this question. Find products similar by description. Suggest instructions that may help in this situation. Find contracts with similar terms.
A regular SQL database does not solve these tasks very well. It does not understand that “customer claim”, “delivery complaint” and “dissatisfaction with delivery times” can be semantically close.
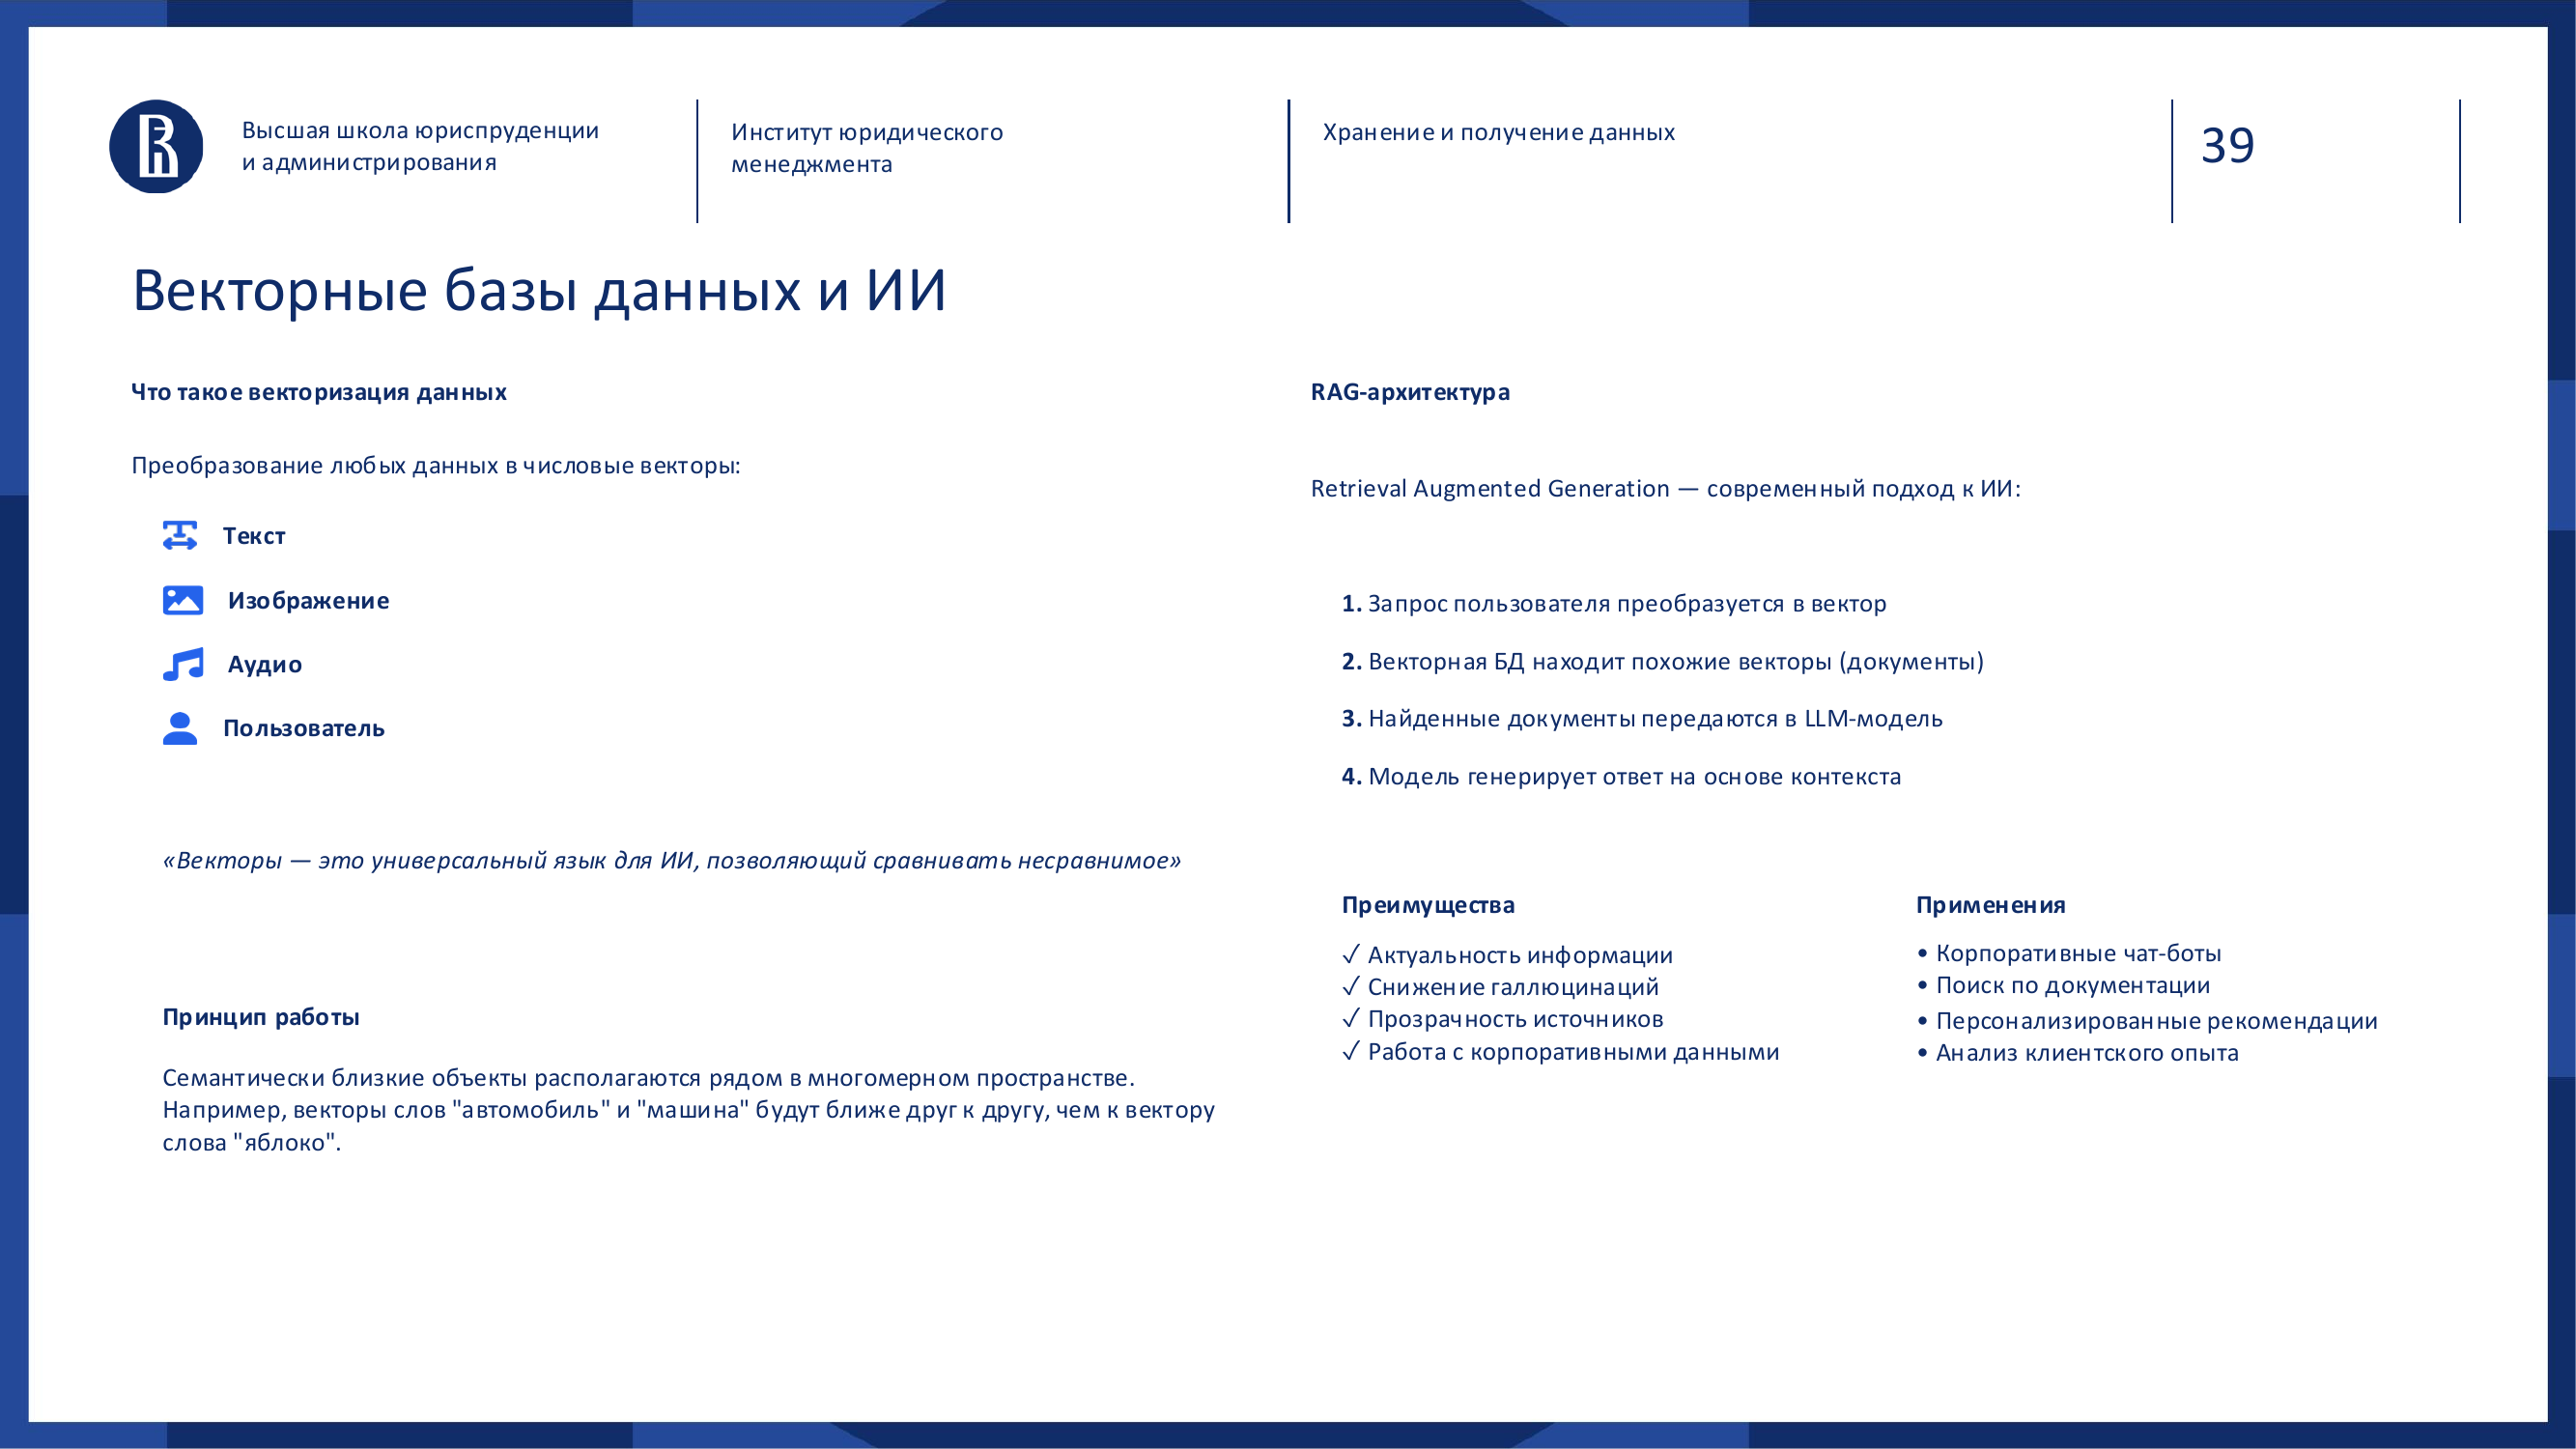
For this, data is turned into vectors.
### What vectorization is
Vectorization is the transformation of an object into a set of numbers.
Text, an image, audio, a user profile or a document becomes a numeric “fingerprint”.
The idea is that objects close in meaning end up near each other in a multidimensional space.
Analogy: imagine a map where meanings, not cities, are located near each other.
The words “automobile” and “car” will be close. “Business trip” and “work travel” will also be close. But “apple” will be farther away if the context is transport or documents.
A vector database stores these fingerprints and can quickly search for the nearest ones.
### Why business needs this
Vector databases are needed where similarity matters:
- search across corporate documents;
- smart FAQ;
- recommendation systems;
- customer request analysis;
- search for similar incidents;
- product matching;
- contract processing;
- AI assistants;
- RAG systems.
And this brings us to RAG.
### What RAG is
RAG means Retrieval Augmented Generation. In simple terms: generation enhanced with search.
The idea is simple: a language model should not answer only “from its head”. It should first find relevant fragments in your corporate data, and then use them as context for the answer.
How it works:
1. Corporate documents are split into fragments. 2. Each fragment is turned into a vector. 3. The vectors are stored in a vector database. 4. A user asks a question. 5. The question is also turned into a vector. 6. The vector database searches for similar fragments. 7. The found fragments are passed to the LLM as context. 8. The model generates an answer based on the found materials.
Example.
An employee asks: “How do I arrange a business trip in May?”
The system does not just generate a generic answer. It searches internal HR documents, finds the business travel policy, current rules, restrictions and the request form, and only then creates the answer.
That is why RAG is so important for business.
It lets AI work not in general, but with your knowledge, your documents and your rules.
### Why AI does not work without data
Many companies want to introduce AI, but start with the model.
Which model should we choose? Which chatbot should we install? Which interface should we build? Which LLM should we connect?
These are important questions, but they are not the first ones.
The first question is different:
> Where is your data, can it be trusted and can access to it be granted safely?
> Questions for a manager > > - Which internal documents should an AI system see, and which must it not see? > - Who is responsible for keeping the knowledge base used by RAG up to date? > - How will you know that an AI answer is based on the right source?
If documents are outdated, the knowledge base is not maintained, access rights are not described, data is duplicated and policies contradict each other, AI will simply accelerate chaos.
It will answer quickly and confidently based on bad data.
That is more dangerous than a slow manual process.
---
What a manager should take away
If we compress the whole article into several management conclusions, they are these.
1. Data is an asset. Data should not be a by-product of system work. It should have owners, quality rules, a lifecycle and clear use cases.
2. Responsibility for data cannot belong only to IT. IT is responsible for infrastructure and implementation. But the business defines data meaning, metric calculation rules, priorities and value.
3. There is no universal database. SQL, NoSQL, NewSQL, column-oriented, graph, vector and in-memory databases are not a fashionable zoo. They are tools for different tasks.
A bad question: “Which database is better?” A good question: “What task are we solving, what data do we have and what requirements do we have for speed, quality, scale and consistency?”
4. OLTP and OLAP should be separated by meaning. Operational systems record business events. Analytical systems help understand the whole picture.
A cash register and an analytics department are different things. A database for orders and a database for strategic reporting often should be different too.
5. Architecture matters more than a single tool. You can buy an expensive platform and get no result. You can start with simple steps and quickly improve decision quality.
What matters is not the technology name, but how data travels from source to decision.
6. Import substitution is a strategic project. You cannot replace a DBMS by saying “let's install an analogue”. Workload, compatibility, team, migration, certification, support and risks must be analyzed.
7. AI starts not with a model, but with data. Vector databases, RAG and LLMs create major opportunities. But only if the company understands where its knowledge lives, how current it is and who is responsible for it.
---
Instead of a conclusion
We started with a simple idea: data is an asset, not infrastructure.
But data does not become an asset automatically. Not because it is stored in a database. Not because BI is connected. Not because the company bought a platform or introduced AI.
Data becomes an asset when it is managed.
When it is clear who is responsible for it. When there is quality. When there are shared definitions. When data can be found. When it can be trusted. When it helps make decisions. When business and IT speak the same language.
A leader does not need to know every technical detail. But they do need to understand the map of the territory.
Without that map, it is very easy to end up in a situation where the company seems to have everything: CRM, ERP, reports, BI, databases, storage layers and AI pilots.
And decisions are still made by guesswork.
That is exactly what we want to avoid.